 PAUWES Data Portal
Wind Power
Keywords
Regions
Contact for the resource
Provided by
Years
Formats
Representation types
Update frequencies
status
Scale
-
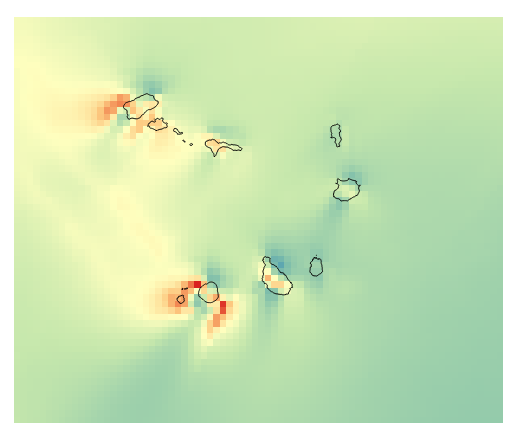
Created by NOVELTIS for ECREEE during the ACP-EU project ECOWREX2. This dataset shows the average Wind Power Density at 100 meter high over the year 2013. The average is calculated from hourly time series data generated by NOVELTIS meso-scale Numeric Weather Prediction system. The resolution is 8km x 8km. The unit is W/m2. The projection is latlon, EPSG 4326, WGS 84. This dataset is not indicated for local studies but only for regional comparison. The annual average was calculated from hourly time series data generated by NOVELTIS meso-scale Numeric Weather Prediction system over the full 2013 year. The values are calculated from NWP output extracted parameters: U = West-East component of the wind speed V = South-North component of the wind speed. ALT = inverse density AL = inverse perturbation density According to the following formula: WPD = 1/2* 1/(ALT+AL) * (WS)3 With WS = √(U2 + V2) The 2013 year was selected by NOVELTIS as TMY (typical meteorological year) through a regional climatic analysis for the period from 2000 to 2014. Minimum=244.157 W/m2 Maximum=1536.362 W/m2 Mean=563.507 W/m2 StdDev=136.221 W/m2