 PAUWES Data Portal
GeoTIFF
Keywords
Regions
Contact for the resource
Provided by
Years
Formats
Representation types
Update frequencies
status
Scale
Resolution
-
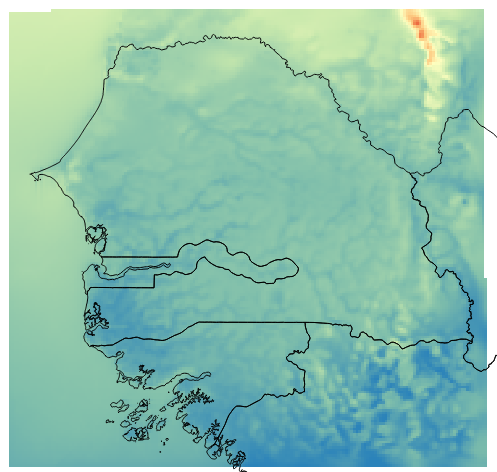
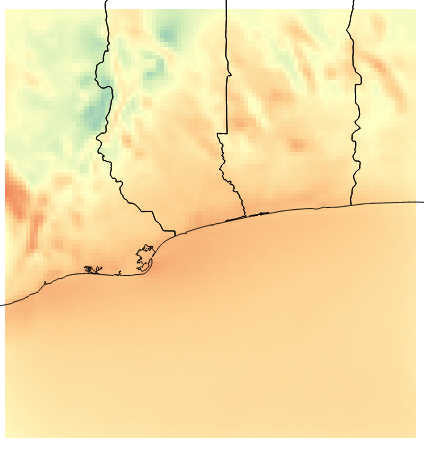
Created by NOVELTIS for ECREEE during the ACP-EU project ECOWREX 2: Promoting Sustainable Energy Development through the use of Geospatial Technologies in West Africa This dataset shows the average Wind Speed at 100 meter high over the year 2013. The average is calculated from hourly time series data generated by NOVELTIS meso-scale Numeric Weather Prediction system. The resolution is 4km x 4km. The unit is m/s. Projection is latlon, EPSG 4326, WGS 84. This dataset is not indicated for local studies but only for regional comparison. The annual average was calculated from hourly time series data generated by NOVELTIS meso-scale Numeric Weather Prediction system over the full year 2013. The values are calculated from NWP output extracted parameters at a level close to 100 meter: U = West-East component of the wind speed V = South-North component of the wind speed. The 2013 year was selected by NOVELTIS as TMY (typical meteorological year) through a regional climatic analysis for the period from 2000 to 2014. Minimum= 2.95 m/s Maximum= 9.16 m/s Mean= 6.5 m/s StdDev= 0.852 m/s
-
Created by NOVELTIS for ECREEE during the ACP-EU project ECOWREX 2: Promoting Sustainable Energy Development through the use of Geospatial Technologies in West Africa This dataset shows the average Wind Power Density at 80 meter high over the year 2013. The average is calculated from hourly time series data generated by NOVELTIS meso-scale Numeric Weather Prediction system. The resolution is 4km x 4km. The unit is W/m2. Projection is latlon, EPSG 4326, WGS 84. This dataset is not indicated for local studies but only for regional comparison. The annual average was calculated from hourly time series data generated by NOVELTIS meso-scale Numeric Weather Prediction system over the full 2013 year. The values are calculated from NWP output extracted parameters: U = West-East component of the wind speed V = South-North component of the wind speed. ALT = inverse density AL = inverse perturbation density According to the following formula: WPD = 1/2* 1/(ALT+AL) * (WS)3 With WS = √(U2 + V2) The 2013 year was selected by NOVELTIS as TMY (typical meteorological year) through a regional climatic analysis for the period from 2000 to 2014. Minimum=37.158 W/m2 Maximum=780.918 W/m2 Mean=176.734 W/m2 StdDev=66.407 W/m2
-
Created by NOVELTIS for ECREEE during the ACP-EU project ECOWREX 2: Promoting Sustainable Energy Development through the use of Geospatial Technologies in West Africa This dataset shows the average Wind Power Density at 60 meter high over the year 2013. The average is calculated from hourly time series data generated by NOVELTIS meso-scale Numeric Weather Prediction system. The resolution is 4km x 4km. The unit is W/m2. Projection is latlon, EPSG 4326, WGS 84. This dataset is not indicated for local studies but only for regional comparison. The annual average was calculated from hourly time series data generated by NOVELTIS meso-scale Numeric Weather Prediction system over the full 2013 year. The values are calculated from NWP output extracted parameters: U = West-East component of the wind speed V = South-North component of the wind speed. ALT = inverse density AL = inverse perturbation density According to the following formula: WPD = 1/2* 1/(ALT+AL) * (WS)3 With WS = √(U2 + V2) The 2013 year was selected by NOVELTIS as TMY (typical meteorological year) through a regional climatic analysis for the period from 2000 to 2014. Minimum=28.124 W/m2 Maximum=206.186 W/m2 Mean=103.239 W/m2 StdDev=31.122 W/m2
-

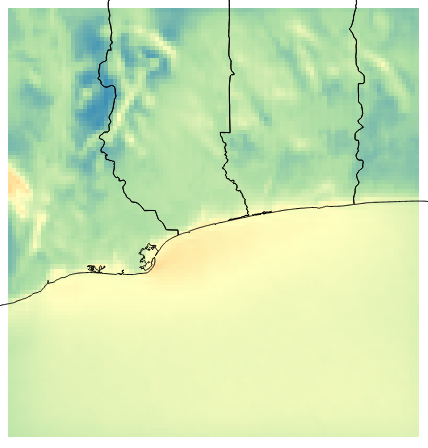
The time series of maps is showing three differnt forage parameters (green biomass, metabolisable energy, metabolisable energy yield) from 04.12.2015 to 29.09.2016. The covered area matches the Vea catchment at the border region of Ghana and Burkina Faso. For model calibration, data was collected during the rainy season 2012 at 21 sites spread along a north-south climate gradient reaching from northern Ghana to central Burkina Faso. Spectral reflectance measurements of vegetation plots were performed using a FieldSpec 3 Hi-Res Portable Spectroradiometer (ASD Inc., Boulder, CO, USA). Partial least squares regression was used to calibrate spectral models between reflectance data and forage characteristics (green biomass & metabolisable energy). Metabolisable enrgy yield was calculated based on the other two forage parameters. For more details regarding sampling design and model calibration, see Ferner, Linstädter et al. (2015). Sentinel-2 images were acquired for twelve dates. Imagery was atmospherically corrected using the plugin ‘sen2cor’ within the SNAP toolbox, provided by the European Space Agency (ESA). To assure that forage models were only applied on vegetated areas, a vegetation mask was build based on MESMA (multiple endmember spectral mixture analysis) and only pixels with a fractional cover of green vegetation of more than 30% were used. Finally, forage provision models resampled to Sentinel-2 spectral resolution were applied to obtain maps of estimated forage provision. Further information: Ferner, J., Linstädter, A., Südekum, K. H., & Schmidtlein, S. (2015). Spectral indicators of forage quality in West Africa’s tropical savannas. International Journal of Applied Earth Observation and Geoinformation, 41, 99-106.
-

Created by NOVELTIS for ECREEE during the ACP-EU project ECOWREX2. This dataset shows the average Wind Speed at 80 meter high over the year 2013. The average is calculated from hourly time series data generated by NOVELTIS meso-scale Numeric Weather Prediction system. The resolution is 8km x 8km. The unit is m/s. The projection is latlon, EPSG 4326, WGS 84. This dataset is not indicated for local studies but only for regional comparison. The annual average was calculated from hourly time series data generated by NOVELTIS meso-scale Numeric Weather Prediction system over the full 2013 year. The values are calculated from NWP output extracted parameters: U = West-East component of the wind speed V = South-North component of the wind speed. The 2013 year was selected by NOVELTIS as TMY (typical meteorological year) through a regional climatic analysis for the period from 2000 to 2014. Minimum=3.253 m/s Maximum=6.547 m/s Mean=4.698 m/s StdDev=0.573 m/s
-
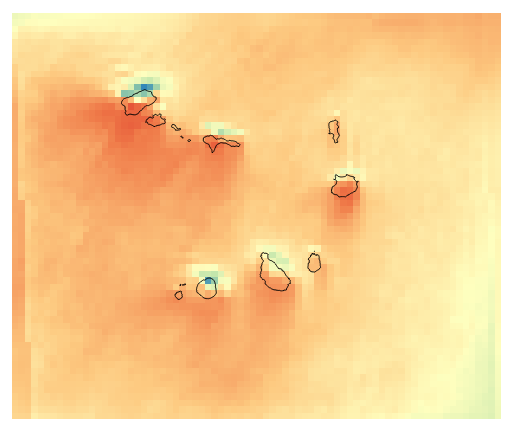
Created by NOVELTIS for ECREEE during the ACP-EU project ECOWREX2. This dataset shows the average ground GHI (Global Horizontal Irradiation) over the year 2013. The average is calculated from hourly time series data generated by NOVELTIS meso-scale Numeric Weather Prediction system. The resolution is 8km x 8km. The unit is kW / m2 / year. The projection is latlon, EPSG 4326, WGS 84. This dataset is not indicated for local studies but only for regional comparison. The annual average was calculated from hourly time series data generated by NOVELTIS meso-scale Numeric Weather Prediction system over the full 2013 year. The parameter extracted from the NWP output is SWDOWN = Downward short wave radiation at ground surface. The 2013 year was selected by NOVELTIS as TMY (typical meteorological year) through a regional climatic analysis for the period from 2000 to 2014. Minimum=1509.848 kW/ m2/year Maximum=2056.843 kW/ m2/year Mean=1880.775 kW/ m2/year StdDev=53.214 kW/ m2/year
-
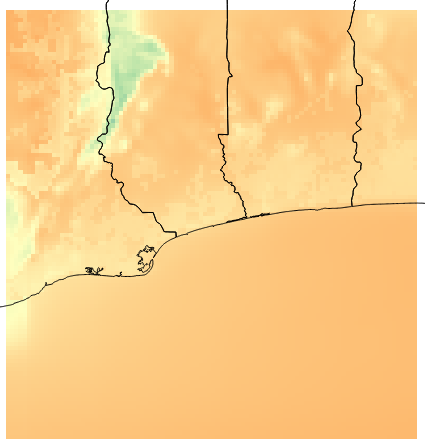
Created by NOVELTIS for ECREEE during the ACP-EU project ECOWREX 2: Promoting Sustainable Energy Development through the use of Geospatial Technologies in West Africa This dataset shows the average Wind Speed at 100 meter high over the year 2013. The average is calculated from hourly time series data generated by NOVELTIS meso-scale Numeric Weather Prediction system. The resolution is 4km x 4km. The unit is m/s. Projection is latlon, EPSG 4326, WGS 84. This dataset is not indicated for local studies but only for regional comparison. The annual average was calculated from hourly time series data generated by NOVELTIS meso-scale Numeric Weather Prediction system over the full 2013 year. The values are calculated from NWP output extracted parameters: U = West-East component of the wind speed V = South-North component of the wind speed. The 2013 year was selected by NOVELTIS as TMY (typical meteorological year) through a regional climatic analysis for the period from 2000 to 2014. Minimum=3.281 m/s Maximum=7.041 m/s Mean=5.490 m/s StdDev=0.501 m/s
-
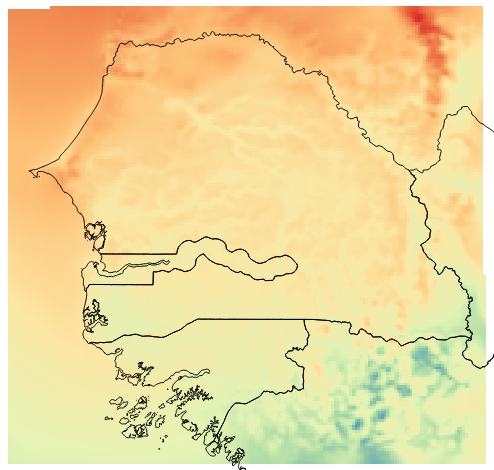
Created by NOVELTIS for ECREEE during the ACP-EU project ECOWREX 2: Promoting Sustainable Energy Development through the use of Geospatial Technologies in West Africa This dataset shows the average temperature at 2 meter over the year 2013. The average is calculated from hourly time series data generated by NOVELTIS meso-scale Numeric Weather Prediction system. The resolution is 4km x 4km. The unit is degree Celsius. Projection is latlon, EPSG 4326, WGS 84. This dataset is not indicated for local studies but only for regional comparison. The annual average was calculated from hourly time series data generated by NOVELTIS meso-scale Numeric Weather Prediction system over the full 2013 year. The parameter extracted from the NWP output is T2 = Temperature at 2 meter. The 2013 year was selected by NOVELTIS as TMY (typical meteorological year) through a regional climatic analysis for the period from 2000 to 2013. Minimum=22.163 °C Maximum=27.466 °C Mean=26.475 °C StdDev=0.641 °C
-
Created by NOVELTIS for ECREEE during the ACP-EU project ECOWREX2. This dataset shows the average Wind Power Density at 40 meter high over the year 2013. The average is calculated from hourly time series data generated by NOVELTIS meso-scale Numeric Weather Prediction system. The resolution is 8km x 8km. The unit is W/m2. The projection is latlon, EPSG 4326, WGS 84. This dataset is not indicated for local studies but only for regional comparison. The annual average was calculated from hourly time series data generated by NOVELTIS meso-scale Numeric Weather Prediction system over the full 2013 year. The values are calculated from NWP output extracted parameters: U = West-East component of the wind speed V = South-North component of the wind speed. ALT = inverse density AL = inverse perturbation density According to the following formula: WPD = 1/2* 1/(ALT+AL) * (WS)3 With WS = √(U2 + V2) The 2013 year was selected by NOVELTIS as TMY (typical meteorological year) through a regional climatic analysis for the period from 2000 to 2014. Minimum=164.779 W/m2 Maximum=1269.543 W/m2 Mean=471.307 W/m2 StdDev=107.714 W/m2
-
Created by NOVELTIS for ECREEE during the ACP-EU project ECOWREX2. This dataset shows the average Wind Power Density at 100 meter high over the year 2013. The average is calculated from hourly time series data generated by NOVELTIS meso-scale Numeric Weather Prediction system. The resolution is 8km x 8km. The unit is W/m2. The projection is latlon, EPSG 4326, WGS 84. This dataset is not indicated for local studies but only for regional comparison. The annual average was calculated from hourly time series data generated by NOVELTIS meso-scale Numeric Weather Prediction system over the full 2013 year. The values are calculated from NWP output extracted parameters: U = West-East component of the wind speed V = South-North component of the wind speed. ALT = inverse density AL = inverse perturbation density According to the following formula: WPD = 1/2* 1/(ALT+AL) * (WS)3 With WS = √(U2 + V2) The 2013 year was selected by NOVELTIS as TMY (typical meteorological year) through a regional climatic analysis for the period from 2000 to 2014. Minimum=244.157 W/m2 Maximum=1536.362 W/m2 Mean=563.507 W/m2 StdDev=136.221 W/m2