 PAUWES Data Portal
Benin
Keywords
Regions
Contact for the resource
Provided by
Years
Formats
Representation types
Update frequencies
status
Scale
-
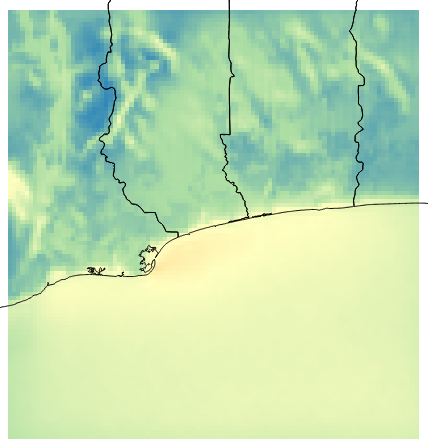
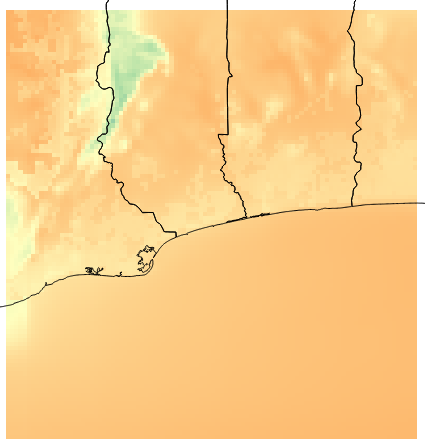
Created by NOVELTIS for ECREEE during the ACP-EU project ECOWREX 2: Promoting Sustainable Energy Development through the use of Geospatial Technologies in West Africa This dataset shows the average Wind Power Density at 80 meter high over the year 2013. The average is calculated from hourly time series data generated by NOVELTIS meso-scale Numeric Weather Prediction system. The resolution is 4km x 4km. The unit is W/m2. Projection is latlon, EPSG 4326, WGS 84. This dataset is not indicated for local studies but only for regional comparison. The annual average was calculated from hourly time series data generated by NOVELTIS meso-scale Numeric Weather Prediction system over the full 2013 year. The values are calculated from NWP output extracted parameters: U = West-East component of the wind speed V = South-North component of the wind speed. ALT = inverse density AL = inverse perturbation density According to the following formula: WPD = 1/2* 1/(ALT+AL) * (WS)3 With WS = √(U2 + V2) The 2013 year was selected by NOVELTIS as TMY (typical meteorological year) through a regional climatic analysis for the period from 2000 to 2014. Minimum=32.834 W/m2 Maximum=231.152 W/m2 Mean=111.235 W/m2 StdDev=28.195 W/m2
-
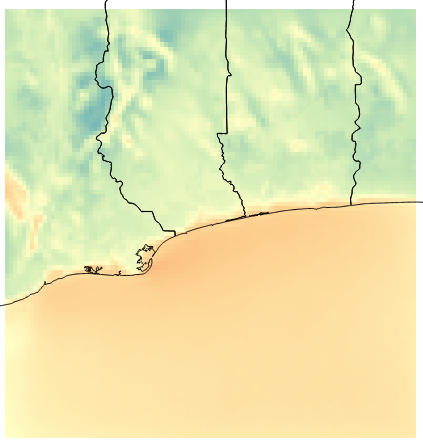
Created by NOVELTIS for ECREEE during the ACP-EU project ECOWREX 2: Promoting Sustainable Energy Development through the use of Geospatial Technologies in West Africa This dataset shows the average Wind Speed at 80 meter high over the year 2013. The average is calculated from hourly time series data generated by NOVELTIS meso-scale Numeric Weather Prediction system. The resolution is 4km x 4km. The unit is m/s. Projection is latlon, EPSG 4326, WGS 84. This dataset is not indicated for local studies but only for regional comparison. The annual average was calculated from hourly time series data generated by NOVELTIS meso-scale Numeric Weather Prediction system over the full 2013 year. The values are calculated from NWP output extracted parameters: U = West-East component of the wind speed V = South-North component of the wind speed. The 2013 year was selected by NOVELTIS as TMY (typical meteorological year) through a regional climatic analysis for the period from 2000 to 2014. Minimum=2.893 m/s Maximum=6.664 m/s Mean=5.149 m/s StdDev=0.624 m/s
-
Created by NOVELTIS for ECREEE during the ACP-EU project ECOWREX 2: Promoting Sustainable Energy Development through the use of Geospatial Technologies in West Africa This dataset shows the average Wind Speed at 40 meter high over the year 2013. The average is calculated from hourly time series data generated by NOVELTIS meso-scale Numeric Weather Prediction system. The resolution is 4km x 4km. The unit is m/s. Projection is latlon, EPSG 4326, WGS 84. This dataset is not indicated for local studies but only for regional comparison. The annual average was calculated from hourly time series data generated by NOVELTIS meso-scale Numeric Weather Prediction system over the full 2013 year. The values are calculated from NWP output extracted parameters: U = West-East component of the wind speed V = South-North component of the wind speed. The 2013 year was selected by NOVELTIS as TMY (typical meteorological year) through a regional climatic analysis for the period from 2000 to 2014. Minimum=2.554 m/s Maximum=6.291 m/s Mean=4.816 m/s StdDev=0.800 m/s
-
Created by NOVELTIS for ECREEE during the ACP-EU project ECOWREX 2: Promoting Sustainable Energy Development through the use of Geospatial Technologies in West Africa This dataset shows the average Wind Power Density at 40 meter high over the year 2013. The average is calculated from hourly time series data generated by NOVELTIS meso-scale Numeric Weather Prediction system. The resolution is 4km x 4km. The unit is W/m2. Projection is latlon, EPSG 4326, WGS 84. This dataset is not indicated for local studies but only for regional comparison. The annual average was calculated from hourly time series data generated by NOVELTIS meso-scale Numeric Weather Prediction system over the full 2013 year. The values are calculated from NWP output extracted parameters: U = West-East component of the wind speed V = South-North component of the wind speed. ALT = inverse density AL = inverse perturbation density According to the following formula: WPD = 1/2* 1/(ALT+AL) * (WS)3 With WS = √(U2 + V2) The 2013 year was selected by NOVELTIS as TMY (typical meteorological year) through a regional climatic analysis for the period from 2000 to 2014. Minimum=23.017 W/m2 Maximum=183.230 W/m2 Mean=94.257 W/m2 StdDev=34.158 W/m2
-
Created by NOVELTIS for ECREEE during the ACP-EU project ECOWREX 2: Promoting Sustainable Energy Development through the use of Geospatial Technologies in West Africa This dataset shows the average Wind Power Density at 60 meter high over the year 2013. The average is calculated from hourly time series data generated by NOVELTIS meso-scale Numeric Weather Prediction system. The resolution is 4km x 4km. The unit is W/m2. Projection is latlon, EPSG 4326, WGS 84. This dataset is not indicated for local studies but only for regional comparison. The annual average was calculated from hourly time series data generated by NOVELTIS meso-scale Numeric Weather Prediction system over the full 2013 year. The values are calculated from NWP output extracted parameters: U = West-East component of the wind speed V = South-North component of the wind speed. ALT = inverse density AL = inverse perturbation density According to the following formula: WPD = 1/2* 1/(ALT+AL) * (WS)3 With WS = √(U2 + V2) The 2013 year was selected by NOVELTIS as TMY (typical meteorological year) through a regional climatic analysis for the period from 2000 to 2014. Minimum=28.124 W/m2 Maximum=206.186 W/m2 Mean=103.239 W/m2 StdDev=31.122 W/m2
-
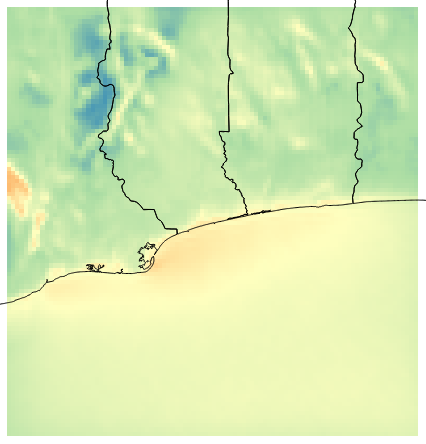
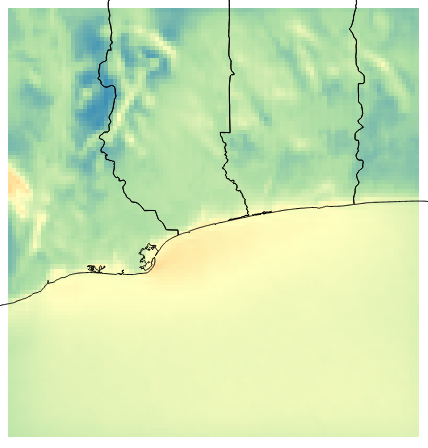
Created by NOVELTIS for ECREEE during the ACP-EU project ECOWREX 2: Promoting Sustainable Energy Development through the use of Geospatial Technologies in West Africa This dataset shows the average ground DNI (Direct Normal Irradiation) over the year 2013. The average is calculated from hourly time series data generated by NOVELTIS meso-scale Numeric Weather Prediction system. The resolution is 4km x 4km. The unit is kW / m2 / year. Projection is latlon, EPSG 4326, WGS 84. This dataset is not indicated for local studies but only for regional comparison. The annual average was calculated from hourly time series data generated by NOVELTIS meso-scale Numeric Weather Prediction system over the full 2013 year. The parameter extracted from the NWP output is SWDDNI= Shortwave surface downward direct normal irradiance. The 2013 year was selected by NOVELTIS as TMY (typical meteorological year) through a regional climatic analysis for the period from 2000 to 2014. Minimum=554.154 kW/m2/y Maximum=1315.542 kW/m2/y Mean=942.285 kW/m2/y StdDev=185.620 kW/m2/y
-
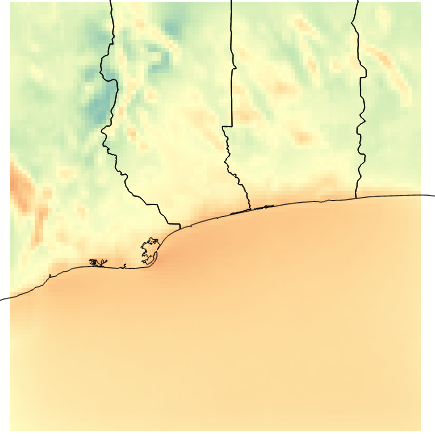
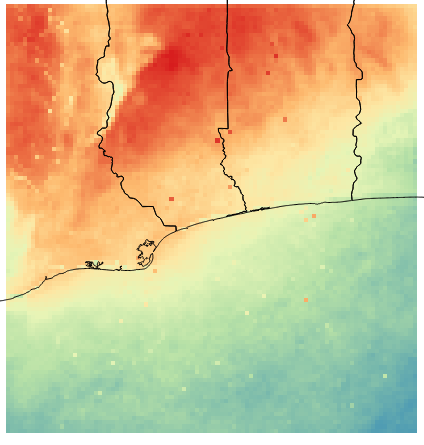
Created by NOVELTIS for ECREEE during the ACP-EU project ECOWREX 2: Promoting Sustainable Energy Development through the use of Geospatial Technologies in West Africa This dataset shows the average temperature at 2 meter over the year 2013. The average is calculated from hourly time series data generated by NOVELTIS meso-scale Numeric Weather Prediction system. The resolution is 4km x 4km. The unit is degree Celsius. Projection is latlon, EPSG 4326, WGS 84. This dataset is not indicated for local studies but only for regional comparison. The annual average was calculated from hourly time series data generated by NOVELTIS meso-scale Numeric Weather Prediction system over the full 2013 year. The parameter extracted from the NWP output is T2 = Temperature at 2 meter. The 2013 year was selected by NOVELTIS as TMY (typical meteorological year) through a regional climatic analysis for the period from 2000 to 2013. Minimum=22.163 °C Maximum=27.466 °C Mean=26.475 °C StdDev=0.641 °C
-

The majority of the people of West Africa are engaged in agriculture and related activities. As such, land is an important factor of agricultural production. But land scarcity and fragmentation in the wake of population growth, climatic variability and environmental deterioration have undermined large-scale agricultural production. This has worsened the poverty and food insecurity situation in the subregion. With migration as an integral feature of the socioeconomic dynamics of most societies, people have–apart from other responses–resorted to migration in search of fertile land and economic opportunities.
-

NAPAs provide a process for the LDCs to identify priority activities that respond to their urgent and immediate needs with regard to adaptation to climate change - those needs for which further delay could increase vulnerability or lead to increased costs at a later stage. The rationale for NAPAs rests on the limited ability of the LDCs to adapt to the adverse effects of climate change. In the NAPA process, prominence is given to community-level input as an important source of information, recognizing that grassroots communities are the main stakeholders. NAPAs use existing information and no new research is needed. They are action-oriented, country-driven, are flexible and based on national circumstances. In order to effectively address urgent and immediate adaptation needs, NAPA documents are presented in a simple format, easily understood both by policy-level decision-makers and the public.
-

Data is on yearly basis.