 PAUWES Data Portal
Gambia
Keywords
Regions
Contact for the resource
Provided by
Years
Formats
Representation types
Update frequencies
status
Scale
-

Monthly evaporation raw data from station Basse in The Gambia.
-
Numbers of households and population by Local Government Areas, Districts, and Settlements, 2013, The Gambia
-

The 2000 National Greenhouse Gas Inventory of The Gambia shows national emission total of about 20.02 Million Tons CO2 Equivalent (TCO2E) and per capita emissions of 13.5 TCO2E. This is insignificant compared to other country emissions. However, as a Party to the Climate Change Convention and its Kyoto Protocol, Gambia is willing to participate in mitigating global emissions and their concentrations in the atmosphere with the first step of conducting a mitigation assessment and developing this NAMA document. Trend analysis of climate data from 1951 to date shows a progressively warming and drier Gambia. Using General Circulation Model outputs, national temperatures are projected to increase by about 0.3OC in 2010 to about 3.9OC in 2100. Rainfall is also projected to decrease by about 1% in 2010 to about 54% in 2100. This confirms previous results of in the First National Communication that with increase in temperatures under a warming climate, rainfall in The Gambia would correspondingly decrease. The development challenges of The Gambia will be significant as the country faces complex economic, social and technological choices based on the climate change impacts already enumerated in the preceding paragraph. This is compounded by the inadequate capacities, inadequacies in the existing technologies and the non availability of domestic funding from both the public and private sectors for climate change.
-
Raw data from several climate stations in The Gambia. Monthly minimum and maximum temperature and rainfall from the stations: - Banjul - Basse - Fatoto - Janjanbureh - Jenoi - Kaur - Kerewan - Sapu - Sibanor - Yundum
-
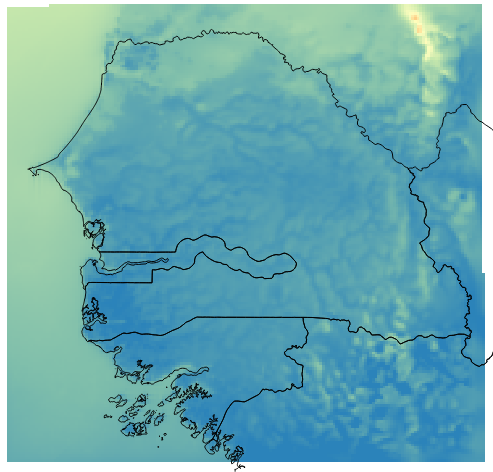
Created by NOVELTIS for ECREEE during the ACP-EU project ECOWREX 2: Promoting Sustainable Energy Development through the use of Geospatial Technologies in West Africa This dataset shows the average Wind Speed at 100 meter high over the year 2013. The average is calculated from hourly time series data generated by NOVELTIS meso-scale Numeric Weather Prediction system. The resolution is 4km x 4km. The unit is m/s. Projection is latlon, EPSG 4326, WGS 84. This dataset is not indicated for local studies but only for regional comparison. The annual average was calculated from hourly time series data generated by NOVELTIS meso-scale Numeric Weather Prediction system over the full year 2013. The values are calculated from NWP output extracted parameters at a level close to 100 meter: U = West-East component of the wind speed V = South-North component of the wind speed. The 2013 year was selected by NOVELTIS as TMY (typical meteorological year) through a regional climatic analysis for the period from 2000 to 2014. Minimum= 2.95 m/s Maximum= 9.16 m/s Mean= 6.5 m/s StdDev= 0.852 m/s
-

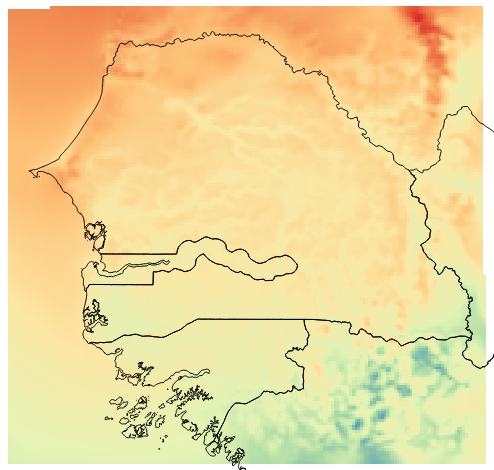
Created by NOVELTIS for ECREEE during the ACP-EU project ECOWREX 2: Promoting Sustainable Energy Development through the use of Geospatial Technologies in West Africa This dataset shows the average temperature at 2 meter over the year 2013. The average is calculated from hourly time series data generated by NOVELTIS meso-scale Numeric Weather Prediction system. The resolution is 4km x 4km. The unit is degree Celcius. Projection is latlon, EPSG 4326, WGS 84. This dataset is not indicated for local studies but only for regional comparison. The annual average was calculated from hourly time series data generated by NOVELTIS meso-scale Numeric Weather Prediction system over the full year 2013. The parameter extracted from the NWP output is T2 = Temperature at 2 meter. The 2013 year was selected by NOVELTIS as TMY (typical meteorological year) through a regional climatic analysis for the period from 2000 to 2014. Minimum=20.633 °C, Maximum=29.597°C Mean=26.395 °C StdDev=1.431 °C
-
Created by NOVELTIS for ECREEE during the ACP-EU project ECOWREX 2: Promoting Sustainable Energy Development through the use of Geospatial Technologies in West Africa This dataset shows the average Wind Power Density at 40 meter high over the year 2013. The average is calculated from hourly time series data generated by NOVELTIS meso-scale Numeric Weather Prediction system. The resolution is 4km x 4km. The unit is W/m2. Projection is latlon, EPSG 4326, WGS 84. This dataset is not indicated for local studies but only for regional comparison. The annual average was calculated from hourly time series data generated by NOVELTIS meso-scale Numeric Weather Prediction system over the full 2013 year. The values are calculated from NWP output extracted parameters: U = West-East component of the wind speed V = South-North component of the wind speed. ALT = inverse density AL = inverse perturbation density According to the following formula: WPD = 1/2* 1/(ALT+AL) * (WS)3 With WS = √(U2 + V2) The 2013 year was selected by NOVELTIS as TMY (typical meteorological year) through a regional climatic analysis for the period from 2000 to 2014. Minimum=27.706 W/m2 Maximum=583.235 W/m2 Mean=124.764 W/m2 StdDev=57.928 W/m2
-

Created by NOVELTIS for ECREEE during the ACP-EU project ECOWREX 2: Promoting Sustainable Energy Development through the use of Geospatial Technologies in West Africa This dataset shows the average Wind Power Density at 60 meter high over the year 2013. The average is calculated from hourly time series data generated by NOVELTIS meso-scale Numeric Weather Prediction system. The resolution is 4km x 4km. The unit is W/m2. Projection is latlon, EPSG 4326, WGS 84. This dataset is not indicated for local studies but only for regional comparison. The annual average was calculated from hourly time series data generated by NOVELTIS meso-scale Numeric Weather Prediction system over the full 2013 year. The values are calculated from NWP output extracted parameters: U = West-East component of the wind speed V = South-North component of the wind speed. ALT = inverse density AL = inverse perturbation density According to the following formula: WPD = 1/2* 1/(ALT+AL) * (WS)3 With WS = √(U2 + V2) The 2013 year was selected by NOVELTIS as TMY (typical meteorological year) through a regional climatic analysis for the period from 2000 to 2014. Minimum=32.506 W/m2 Maximum=688.547 W/m2 Mean=150.551 W/m2 StdDev=61.167 W/m2
-

The Republic of The Gambia ratified the United Nations Framework Convention on Climate Change (UNFCCC) in 1994 committing the country to the adoption and implementation of policies and measures mitigating the causes of climate change and adapting to its adverse effects. This Second National Communication (SNC), prepared and submitted in fulfilment of Articles 4 and 12 of the UNFCCC follows and builds on the Initial National Communication (INC) submitted in 2003. Similarly, its preparation follows the UNFCCC guidelines and includes information on The Gambia‟s greenhouse gas inventory for the year 2000, a discussion of measures to mitigate emissions in the energy sector, vulnerability and promising adaptation measures in key socioeconomic sectors as well as other activities contributing to building resilience to climate change.
-

This historical timeline summarizes the most important events of the CCA Policy Process in The Gambia.