 PAUWES Data Portal
Sierra Leone
Keywords
Regions
Contact for the resource
Provided by
Years
Formats
Representation types
Update frequencies
status
Scale
-

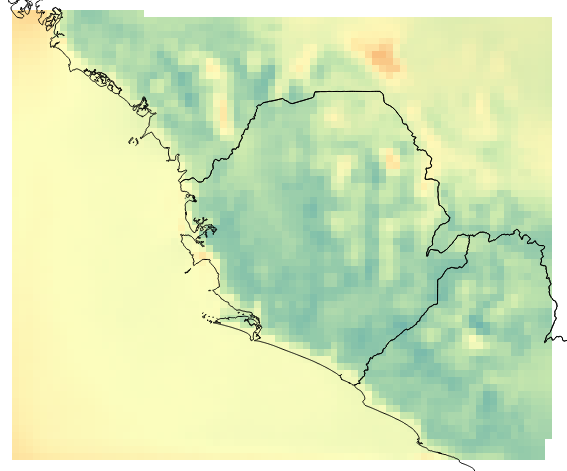
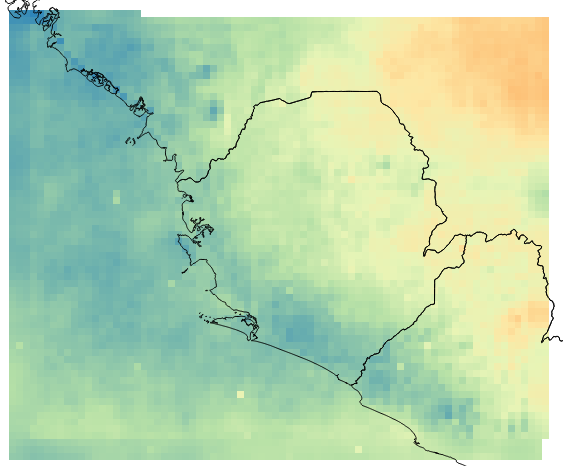
Created by NOVELTIS for ECREEE during the ACP-EU project ECOWREX 2: Promoting Sustainable Energy Development through the use of Geospatial Technologies in West Africa. This dataset shows the average temperature at 2 meter over the year 2013. The average is calculated from hourly time series data generated by NOVELTIS meso-scale Numeric Weather Prediction system. The resolution is 8km x 8km. The unit is degree Celsius. The projection is latlon, EPSG 4326, WGS 84. This dataset is not indicated for local studies but only for regional comparison. The annual average was calculated from hourly time series data generated by NOVELTIS meso-scale Numeric Weather Prediction system over the full 2013 year. The parameter extracted from the NWP output is T2 = Temperature at 2 meter. The 2013 year was selected by NOVELTIS as TMY (typical meteorological year) through a regional climatic analysis for the period from 2000 to 2014. Minimum=21.297 °C Maximum=27.597 °C Mean=25.689 °C StdDev=1.374 °C
-

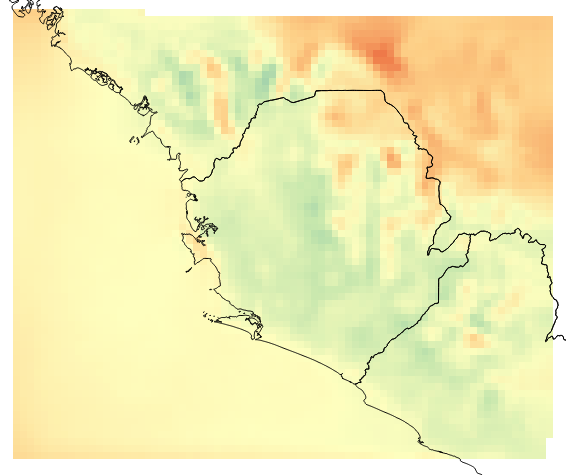
Created by NOVELTIS for ECREEE during the ACP-EU project ECOWREX2. This dataset shows the average Wind Power Density at 100 meter high over the year 2013. The average is calculated from hourly time series data generated by NOVELTIS meso-scale Numeric Weather Prediction system. The resolution is 8km x 8km. The unit is W/m2. The projection is latlon, EPSG 4326, WGS 84. This dataset is not indicated for local studies but only for regional comparison. The annual average was calculated from hourly time series data generated by NOVELTIS meso-scale Numeric Weather Prediction system over the full 2013 year. The values are calculated from NWP output extracted parameters: U = West-East component of the wind speed V = South-North component of the wind speed. ALT = inverse density AL = inverse perturbation density According to the following formula: WPD = 1/2* 1/(ALT+AL) * (WS)3 With WS = √(U2 + V2) The 2013 year was selected by NOVELTIS as TMY (typical meteorological year) through a regional climatic analysis for the period from 2000 to 2014. Minimum=64.454 W/m2 Maximum=285.149 W/m2 Mean=129.401 W/m2 StdDev=33.395 W/m2
-
Created by NOVELTIS for ECREEE during the ACP-EU project ECOWREX2. This dataset shows the average Wind Speed at 40 meter high over the year 2013. The average is calculated from hourly time series data generated by NOVELTIS meso-scale Numeric Weather Prediction system. The resolution is 8km x 8km. The unit is m/s. The projection is latlon, EPSG 4326, WGS 84. This dataset is not indicated for local studies but only for regional comparison. The annual average was calculated from hourly time series data generated by NOVELTIS meso-scale Numeric Weather Prediction system over the full 2013 year. The values are calculated from NWP output extracted parameters: U = West-East component of the wind speed V = South-North component of the wind speed. The 2013 year was selected by NOVELTIS as TMY (typical meteorological year) through a regional climatic analysis for the period from 2000 to 2014. Minimum=2.696 m/s Maximum=5.843 m/s Mean=4.310 m/s StdDev=0.709 m/s
-
Created by NOVELTIS for ECREEE during the ACP-EU project ECOWREX2. This dataset shows the average Wind Speed at 60 meter high over the year 2013. The average is calculated from hourly time series data generated by NOVELTIS meso-scale Numeric Weather Prediction system. The resolution is 8km x 8km. The unit is m/s. The projection is latlon, EPSG 4326, WGS 84. This dataset is not indicated for local studies but only for regional comparison. The annual average was calculated from hourly time series data generated by NOVELTIS meso-scale Numeric Weather Prediction system over the full 2013 year. The values are calculated from NWP output extracted parameters: U = West-East component of the wind speed V = South-North component of the wind speed. The 2013 year was selected by NOVELTIS as TMY (typical meteorological year) through a regional climatic analysis for the period from 2000 to 2014. Minimum=2.984 m/s Maximum=6.236 m/s Mean=4.523 m/s StdDev=0.628 m/s
-
Created by NOVELTIS for ECREEE during the ACP-EU project ECOWREX2. This dataset shows the average Wind Speed at 100 meter high over the year 2013. The average is calculated from hourly time series data generated by NOVELTIS meso-scale Numeric Weather Prediction system. The resolution is 8km x 8km. The unit is m/s. The projection is latlon, EPSG 4326, WGS 84. This dataset is not indicated for local studies but only for regional comparison. The annual average was calculated from hourly time series data generated by NOVELTIS meso-scale Numeric Weather Prediction system over the full 2013 year. The values are calculated from NWP output extracted parameters: U = West-East component of the wind speed V = South-North component of the wind speed. The 2013 year was selected by NOVELTIS as TMY (typical meteorological year) through a regional climatic analysis for the period from 2000 to 2014. Minimum=3.579 m/s Maximum=7.085 m/s Mean=5.098 m/s StdDev=0.522 m/s
-

Created by NOVELTIS for ECREEE during the ACP-EU project ECOWREX2. This dataset shows the average Wind Speed at 80 meter high over the year 2013. The average is calculated from hourly time series data generated by NOVELTIS meso-scale Numeric Weather Prediction system. The resolution is 8km x 8km. The unit is m/s. The projection is latlon, EPSG 4326, WGS 84. This dataset is not indicated for local studies but only for regional comparison. The annual average was calculated from hourly time series data generated by NOVELTIS meso-scale Numeric Weather Prediction system over the full 2013 year. The values are calculated from NWP output extracted parameters: U = West-East component of the wind speed V = South-North component of the wind speed. The 2013 year was selected by NOVELTIS as TMY (typical meteorological year) through a regional climatic analysis for the period from 2000 to 2014. Minimum=3.253 m/s Maximum=6.547 m/s Mean=4.698 m/s StdDev=0.573 m/s
-
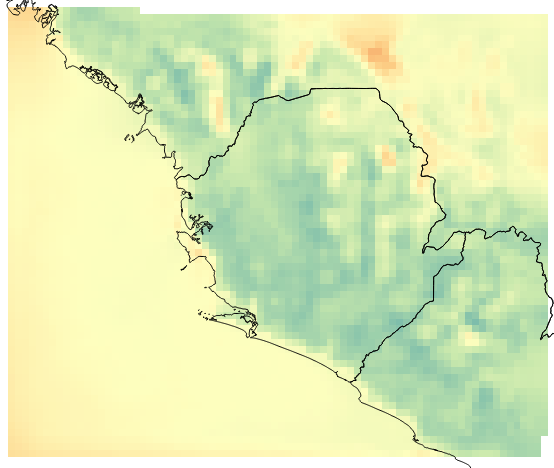
Created by NOVELTIS for ECREEE during the ACP-EU project ECOWREX 2: Promoting Sustainable Energy Development through the use of Geospatial Technologies in West Africa This dataset shows the average ground GHI (Global Horizontal Irradiation) over the year 2013. The average is calculated from hourly time series data generated by NOVELTIS meso-scale Numeric Weather Prediction system. The resolution is 8km x 8km. The unit is kW / m2/ year . The projection is latlon, EPSG 4326, WGS 84. This dataset is not indicated for local studies but only for regional comparison. The annual average was calculated from hourly time series data generated by NOVELTIS meso-scale Numeric Weather Prediction system over the full 2013 year. The parameter extracted from the NWP output is SWDOWN = Downward short wave radiation at ground surface. The 2013 year was selected by NOVELTIS as TMY (typical meteorological year) through a regional climatic analysis for the period from 2000 to 2014. Minimum=1407.855 kW/m2/y Maximum=1913.181 kW/m2/y Mean=1648.582 kW/m2/y StdDev=111.520 kW/m2/y
-
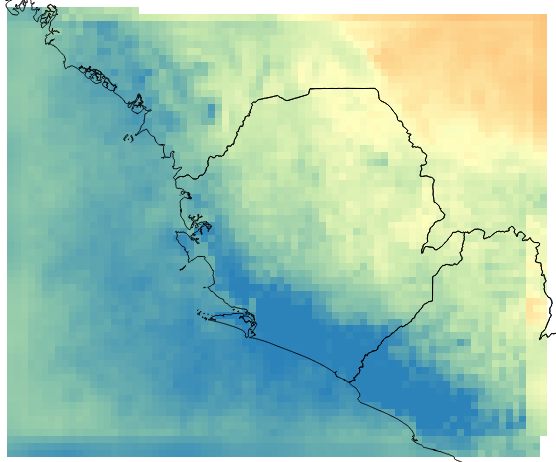
Created by NOVELTIS for ECREEE during the ACP-EU project ECOWREX 2: Promoting Sustainable Energy Development through the use of Geospatial Technologies in West Africa This dataset shows the average ground DNI (Direct Normal Irradiation) over the year 2013. The average is calculated from hourly time series data generated by NOVELTIS meso-scale Numeric Weather Prediction system. The resolution is 8km x 8km. The unit is kW / m2/ year. The projection is latlon, EPSG 4326, WGS 84. This dataset is not indicated for local studies but only for regional comparison. The annual average was calculated from hourly time series data generated by NOVELTIS meso-scale Numeric Weather Prediction system over the full 2013 year. The parameter extracted from the NWP output is SWDDNI= Shortwave surface downward direct normal irradiance. The 2013 year was selected by NOVELTIS as TMY (typical meteorological year) through a regional climatic analysis for the period from 2000 to 2014. Minimum=595.670 kW/m2/y Maximum=1080.467 kW/m2/y Mean=816.374 kW/m2/y StdDev=104.437 kW/m2/y
-

The Government of Sierra Leone has recognised that climate change related disasters such as flooding, drought, coastal erosion, deforestation and biodiversity loss etc. are natural phenomena aggravated by human activities including the emission of green house gases. Damage and losses from such disasters are however the consequence of human action. The National Adaptation Programme of Action (NAPA) for Sierra Leone has been prepared by the Ministry of Transport and Aviation (MTA), as a response to the decision of the Seventh Session of the Conference of the Parties (COP7) of the United Nations Framework Convention on Climate Change (UNFCCC). The preparation process has followed the generic guiding principles outlined in the NAPA annotated Guideline according to the project coordinator. The whole preparation process was guided by the high powered Project Steering Committee headed by the Chairman, Director of the Environment, of the Ministry of Lands, Country Planning and the Environment. The basic approach to NAPA preparation was in consonance with the sustainable development goals and objectives of the country where it has recognized the necessity of addressing environmental issues and natural resource management with the participation of stakeholders.