 PAUWES Data Portal
wind speed
Keywords
Regions
Contact for the resource
Provided by
Years
Formats
Representation types
Update frequencies
status
Scale
-

The daily average wind speed data was obtained from IGEBU (Burundi Geographical Institute) for a period of (2000 – 2018). This data was collected by the station located in Nyanza-Lac area considered by IGEBU having the same climatic conditions as Kigwena village in Bururi.
-

Created by NOVELTIS for ECREEE during the ACP-EU project ECOWREX 2: Promoting Sustainable Energy Development through the use of Geospatial Technologies in West Africa This dataset shows the average Wind Speed at 60 meter high over the year 2013. The average is calculated from hourly time series data generated by NOVELTIS meso-scale Numeric Weather Prediction system. The resolution is 4km x 4km. The unit is m/s. Projection is latlon, EPSG 4326, WGS 84. This dataset is not indicated for local studies but only for regional comparison. The annual average was calculated from hourly time series data generated by NOVELTIS meso-scale Numeric Weather Prediction system over the full 2013 year. The values are calculated from NWP output extracted parameters: U = West-East component of the wind speed V = South-North component of the wind speed. The 2013 year was selected by NOVELTIS as TMY (typical meteorological year) through a regional climatic analysis for the period from 2000 to 2014. Minimum=2.732 m/s Maximum=6.452 m/s Mean=5.000 m/s StdDev=0.703 m/s
-
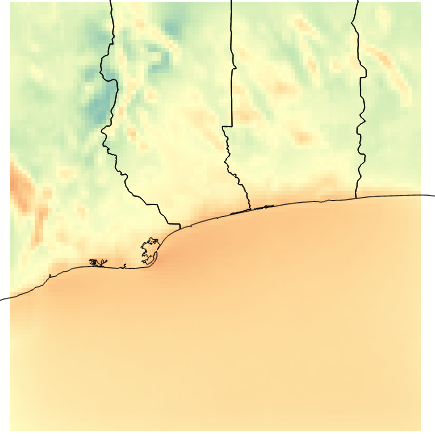
Created by NOVELTIS for ECREEE during the ACP-EU project ECOWREX 2: Promoting Sustainable Energy Development through the use of Geospatial Technologies in West Africa This dataset shows the average Wind Speed at 80 meter high over the year 2013. The average is calculated from hourly time series data generated by NOVELTIS meso-scale Numeric Weather Prediction system. The resolution is 4km x 4km. The unit is m/s. Projection is latlon, EPSG 4326, WGS 84. This dataset is not indicated for local studies but only for regional comparison. The annual average was calculated from hourly time series data generated by NOVELTIS meso-scale Numeric Weather Prediction system over the full 2013 year. The values are calculated from NWP output extracted parameters: U = West-East component of the wind speed V = South-North component of the wind speed. The 2013 year was selected by NOVELTIS as TMY (typical meteorological year) through a regional climatic analysis for the period from 2000 to 2014. Minimum=2.893 m/s Maximum=6.664 m/s Mean=5.149 m/s StdDev=0.624 m/s
-

The hourly meteorological data was obtained from national meteorological Centre and was used in HOMER simulation. The data was recorded at Tororo Automatic weather Station.
-
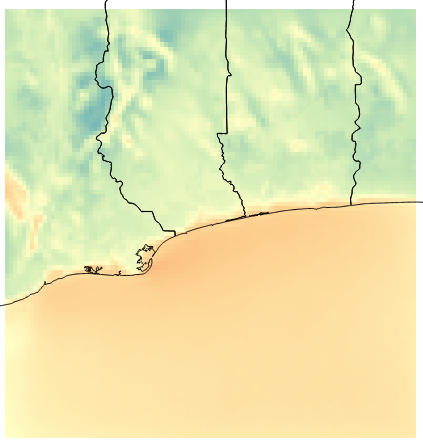
Created by NOVELTIS for ECREEE during the ACP-EU project ECOWREX 2: Promoting Sustainable Energy Development through the use of Geospatial Technologies in West Africa This dataset shows the average Wind Speed at 40 meter high over the year 2013. The average is calculated from hourly time series data generated by NOVELTIS meso-scale Numeric Weather Prediction system. The resolution is 4km x 4km. The unit is m/s. Projection is latlon, EPSG 4326, WGS 84. This dataset is not indicated for local studies but only for regional comparison. The annual average was calculated from hourly time series data generated by NOVELTIS meso-scale Numeric Weather Prediction system over the full 2013 year. The values are calculated from NWP output extracted parameters: U = West-East component of the wind speed V = South-North component of the wind speed. The 2013 year was selected by NOVELTIS as TMY (typical meteorological year) through a regional climatic analysis for the period from 2000 to 2014. Minimum=2.554 m/s Maximum=6.291 m/s Mean=4.816 m/s StdDev=0.800 m/s
-
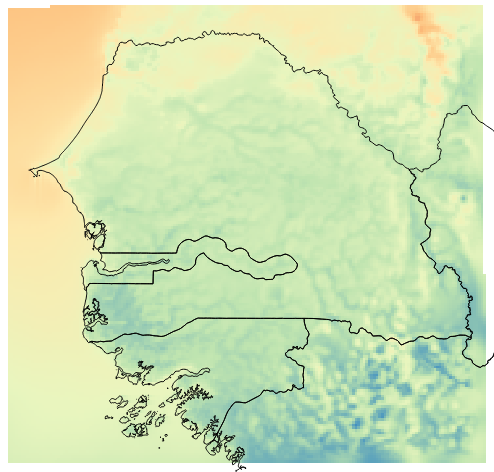
Created by NOVELTIS for ECREEE during the ACP-EU project ECOWREX 2: Promoting Sustainable Energy Development through the use of Geospatial Technologies in West Africa This dataset shows the average Wind Speed at 40 meter high over the year 2013. The average is calculated from hourly time series data generated by NOVELTIS meso-scale Numeric Weather Prediction system. The resolution is 4km x 4km. The unit is m/s. Projection is latlon, EPSG 4326, WGS 84. This dataset is not indicated for local studies but only for regional comparison. The annual average was calculated from hourly time series data generated by NOVELTIS meso-scale Numeric Weather Prediction system over the full year 2013. The values are calculated from NWP output extracted parameters at a level close to 40 meter: U = West-East component of the wind speed V = South-North component of the wind speed. The 2013 year was selected by NOVELTIS as TMY (typical meteorological year) through a regional climatic analysis for the period from 2000 to 2014. Minimum=2.418 m/s Maximum= 7.8 m/s Mean=5.135 m/s StdDev=0.863 m/s
-

Rainfall monthly and yearly cumulative: 1998-2018, max temp monthly and average: 1970-2015, max rainfall monthly and yearly average: 1960-1995, wind speed monthly and yearly average: 1960-2006, evaporation monthly and yearly average: 1986-2015 (with gaps),
-

The meteorological dataset consists of uncorrected half-hourly meteorological measurements for seven climate stations and three eddy covariance stations. The stations belong to the hydro-meteorological network established for the Vea and Sissili watershed in Southern Burkina Faso and Northern Ghana. The dataset contains seven meteorological variables: the mean incoming shortwave radiation [W/m2], the mean incoming longwave radiation [W/m2], the mean air temperature [°C], the mean horizontal wind speed [m/s], the mean horizontal wind direction [°], the mean air pressure [hPa], the mean relative humidity [g/kg] and the total precipitation amount [mm]. The data set is available from October 2012 to October 2016. More recent informatoin and other meteorological variables such as heat fluxes can be provided by request. Further information about the data sets and the meteorological network will be given in a future publication which was recently submitted to a special issue on “Hydrological Observatories” of the Vadose Zone Journal.
-
The meteorological dataset consists of infilled half-hourly meteorological measurements for seven climate stations and three eddy covariance stations. The stations belong to the hydro-meteorological network established for the Vea and Sissili watershed in Southern Burkina Faso and Northern Ghana. The dataset contains seven meteorological variables: the mean incoming shortwave radiation [W/m2], the mean incoming longwave radiation [W/m2], the mean air temperature [°C], the mean horizontal wind speed [m/s], the mean sea level pressure [hPa], the mean specific humidity [g/kg] and the total precipitation amount [mm]. The data set is available from 1st of October 2012 to 31st of December 2013. The infilling of measurements was done using a spatiotemporal infilling algorithm based on an inverse distance approach. Other meteorological information such as heat fluxes can be also provided by request. Further information about the data sets and the meteorological network will be given in a future publication which was recently submitted to a special issue on “Hydrological Observatories” of the Vadose Zone Journal.