 PAUWES Data Portal
http://www.naturalearthdata.com/ne_admin
Keywords
Regions
Contact for the resource
Provided by
Years
Formats
Representation types
Update frequencies
status
Service types
Scale
Resolution
-

The data was collected in the catchment of Lake Cyohoha North to analyze socio-economic impact that the change in Land use/cover and lake degradation have had on smallholder farmers living within this catchment.
-

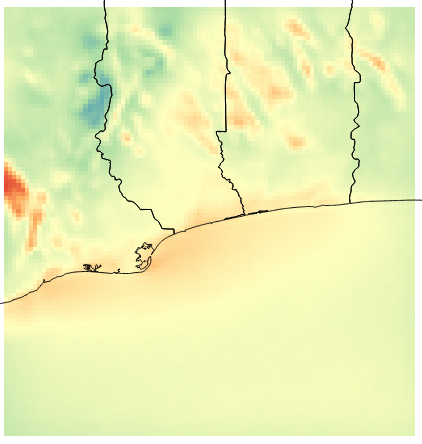
High resolution (12km) regional climate simulations were carried out by the researchers at Karlsruhe Institute of Technology, Institute of Meteorology and Climate Research, Atmospheric Environmental Research (KIT/IMK-IFU) as part of the West Africa Science Service Center on Climate Change and Adapted Land Use (WASCAL) Project. One of the goals of the WASCAL project is to provide the best accuracy in regional climate simulations over the entire West Africa region for a large proportion of the 21st century. The regional climate model employed in the project was the Weather Research and Forecasting Model version 3.5.1 (WRFv3.5.1) forced by three global circulation models (GCMs) under the Representative Concentrative Pathways 4.5 (RCP 4.5). The forcing GCMs are: the Max Planck Institute Earth System Model (MPI-ESM-MR, Stevens et al. 2013), the General Fluid Dynamics Laboratory Earth System Model (GFDL-ESM2M, Dunne et al. 2012), and the Hadley Global Environment Model (HadGEM2-ES, Collins et al. 2011). Further control runs with ERA-Interim reanalysis products (Dee et al. 2011) were also carried out for model verification and bias correction. Therefore, the daily outputs of near-surface air temperature, obtained from the 3-hourly simulations of WRFv3.5.1, driven by MPI-ESM-MR, are hereby presented.
-

NAPAs provide a process for the LDCs to identify priority activities that respond to their urgent and immediate needs with regard to adaptation to climate change - those needs for which further delay could increase vulnerability or lead to increased costs at a later stage. The rationale for NAPAs rests on the limited ability of the LDCs to adapt to the adverse effects of climate change. In the NAPA process, prominence is given to community-level input as an important source of information, recognizing that grassroots communities are the main stakeholders. NAPAs use existing information and no new research is needed. They are action-oriented, country-driven, are flexible and based on national circumstances. In order to effectively address urgent and immediate adaptation needs, NAPA documents are presented in a simple format, easily understood both by policy-level decision-makers and the public.
-

Weekly Shallow Groundwater Level Data from 64 Piezometers in the Dano Catchment, Burkina Faso, 2014-2016
-
Created by NOVELTIS for ECREEE during the ACP-EU project ECOWREX 2: Promoting Sustainable Energy Development through the use of Geospatial Technologies in West Africa This dataset shows the average Wind Power Density at 100 meter high over the year 2013. The average is calculated from hourly time series data generated by NOVELTIS meso-scale Numeric Weather Prediction system. The resolution is 4km x 4km. The unit is W/m2. Projection is latlon, EPSG 4326, WGS 84. This dataset is not indicated for local studies but only for regional comparison. The annual average was calculated from hourly time series data generated by NOVELTIS meso-scale Numeric Weather Prediction system over the full 2013 year. The values are calculated from NWP output extracted parameters: U = West-East component of the wind speed V = South-North component of the wind speed. ALT = inverse density AL = inverse perturbation density According to the following formula: WPD = 1/2* 1/(ALT+AL) * (WS)3 With WS = √(U2 + V2) The 2013 year was selected by NOVELTIS as TMY (typical meteorological year) through a regional climatic analysis for the period from 2000 to 2014. Minimum=45.928 W/m2 Maximum=275.843 W/m2 Mean=132.202 W/m2 StdDev=24.919 W/m2
-

Table with maize biomass and yield (primary/raw) from central field experiment plots in the Vea, Dano and Dassari catchments (main research sites in the WASCAL Core Research Program), Ghana, Burkina Faso and Benin, 2014
-

Data was obtained for quantitative analysis
-

Data on water quality for the various boreholes within Naivasha Sub-county
-

Precipitation data Lare/Burkina Faso Measured parameters: Precipitation Timestep: daily
-

Climate data Wahable/Burkina Faso Measured parameters: Air temperature Relative humidity Solar radiation Precipitation Windspeed Winddirection Timestep: 10 Minutes