 PAUWES Data Portal
ESRI Shapefile
Keywords
Regions
Contact for the resource
Provided by
Years
Formats
Representation types
Update frequencies
status
Scale
-
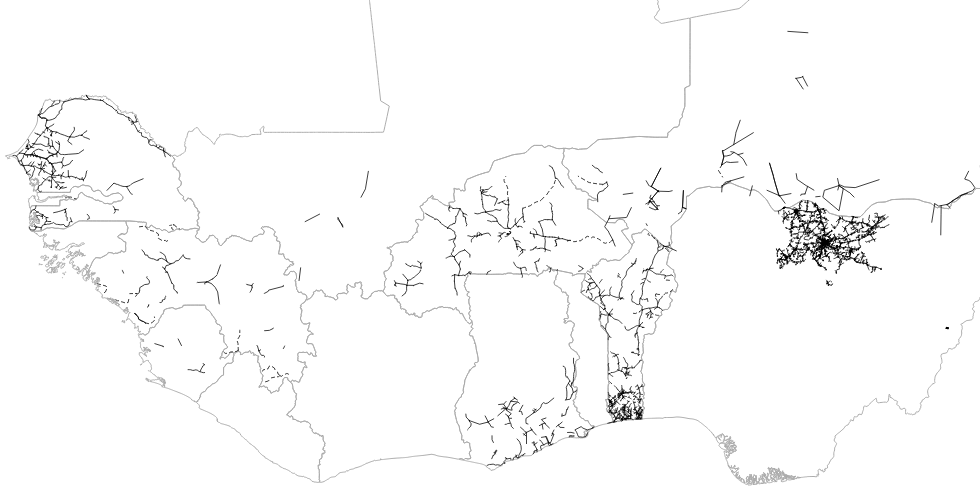
Existing and planned distribution grid network (11KV-33KV) in the ECOWAS region. The dataset is developed by the ECOWREX team by using the following sources of information: - BENIN: Ministry of Energy (2016) - BURKINA FASO: West African Power Pool (WAPP) GIS database January 2017, SONABEL - CÔTE D'IVOIRE: CI-ENERGIES - GAMBIA: WAPP database (2015) - GHANA: Energy Commission (2015) - GUINEA: Ministry of Energy, Energy Information System Unit (SIE, 2016) - MALI: EnergyInfo platform - https://energydata.info/ (World Bank, 2017) - NIGER: EnergyInfo platform - https://energydata.info/ (World Bank, dataset 2015) - NIGERIA: EnergyInfo platform - https://energydata.info/ (World Bank, dataset 2016), Nigeria Rural Electrification Program (http://rrep-nigeria.integration.org/ ), Facebook model (https://energydata.info/dataset/medium-voltage-distribution-predictive) - SENEGAL: EnergyInfo platform - https://energydata.info/ (World Bank, dataset 2007) - SIERRA LEONE: EnergyInfo platfom - https://energydata.info/ (World Bank, 2017)
-
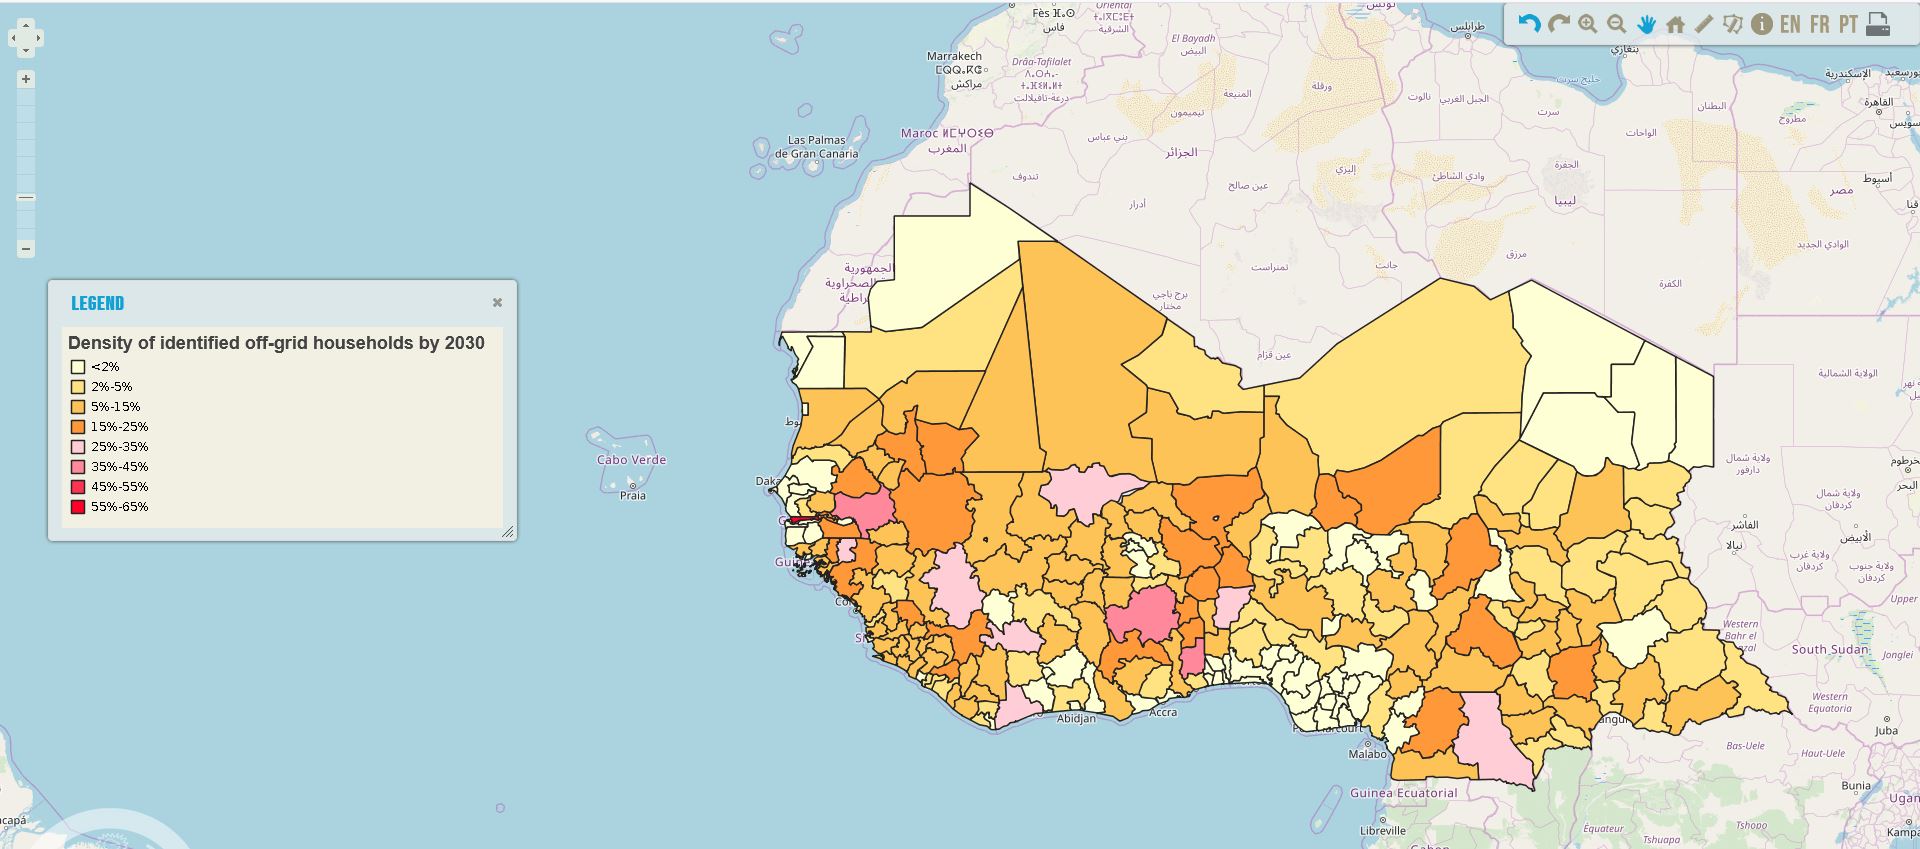
Density of identified off-grid households in ROGEP countries by 2030, per country administrative boundary level 1. The households could have access to electricity through off-grid solutions by 2030 according to the least-cost analysis conducted in the framework of the off-grid solar market assessment and private sector support facility design, which was done as an activity of the sub-component 1A of the Regional Off-Grid Electrification Project (ROGEP).
-
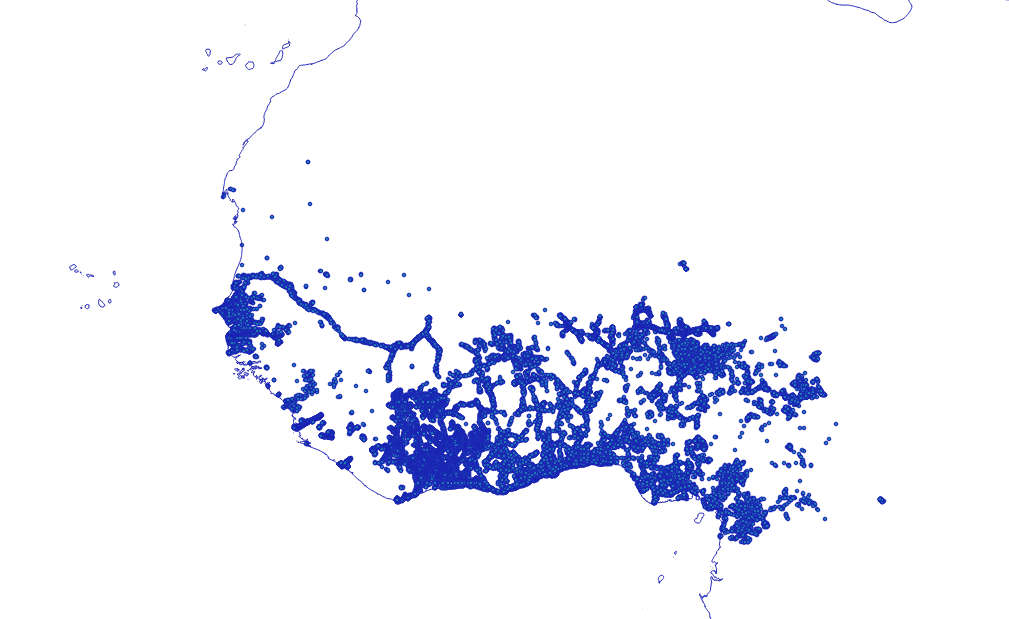
Location of settlements that could be connected to national electricity grids in 2023 according to the least-cost analysis conducted in the framework of the off-grid solar market assessment and private sector support facility design, which was done as an activity of the sub-component 1A of the Regional Off-Grid Electrification Project (ROGEP).
-

Livelihood zoning consists in identifying areas where rural people share relatively homogeneous living conditions, on the basis of a combination of biophysical and socio-economic determinants. The main criteria to establish livelihood zones are: the predominant source of income (livelihood activities); the natural resources available to people and the way they are used; and the prevailing agroclimatic conditions that influence farming activities. Patterns of livelihood vary from one area to another, based on local factors such as climate, soil or access to markets. The analysis delineates geographical areas within which people share similar livelihood patterns: source of living, access to food, farming practices, including crops, livestock and access to markets. The map of livelihood zones is the main output from a participatory mapping workshop and forms the basis for the overall AWM assessment. It describes and geographically locates the different country livelihood contexts, focusing on the main smallholders’ livelihood strategies, their water-related problems and other constraints for development, and the role agricultural water management plays for their livelihoods. An attribute table provides a detailed description of each livelihood zone. (Source: FAO, 2011)
-

Map of discharge stations used by Mouhamed Idrissou for getting runoff data from the Dano Catchment.
-
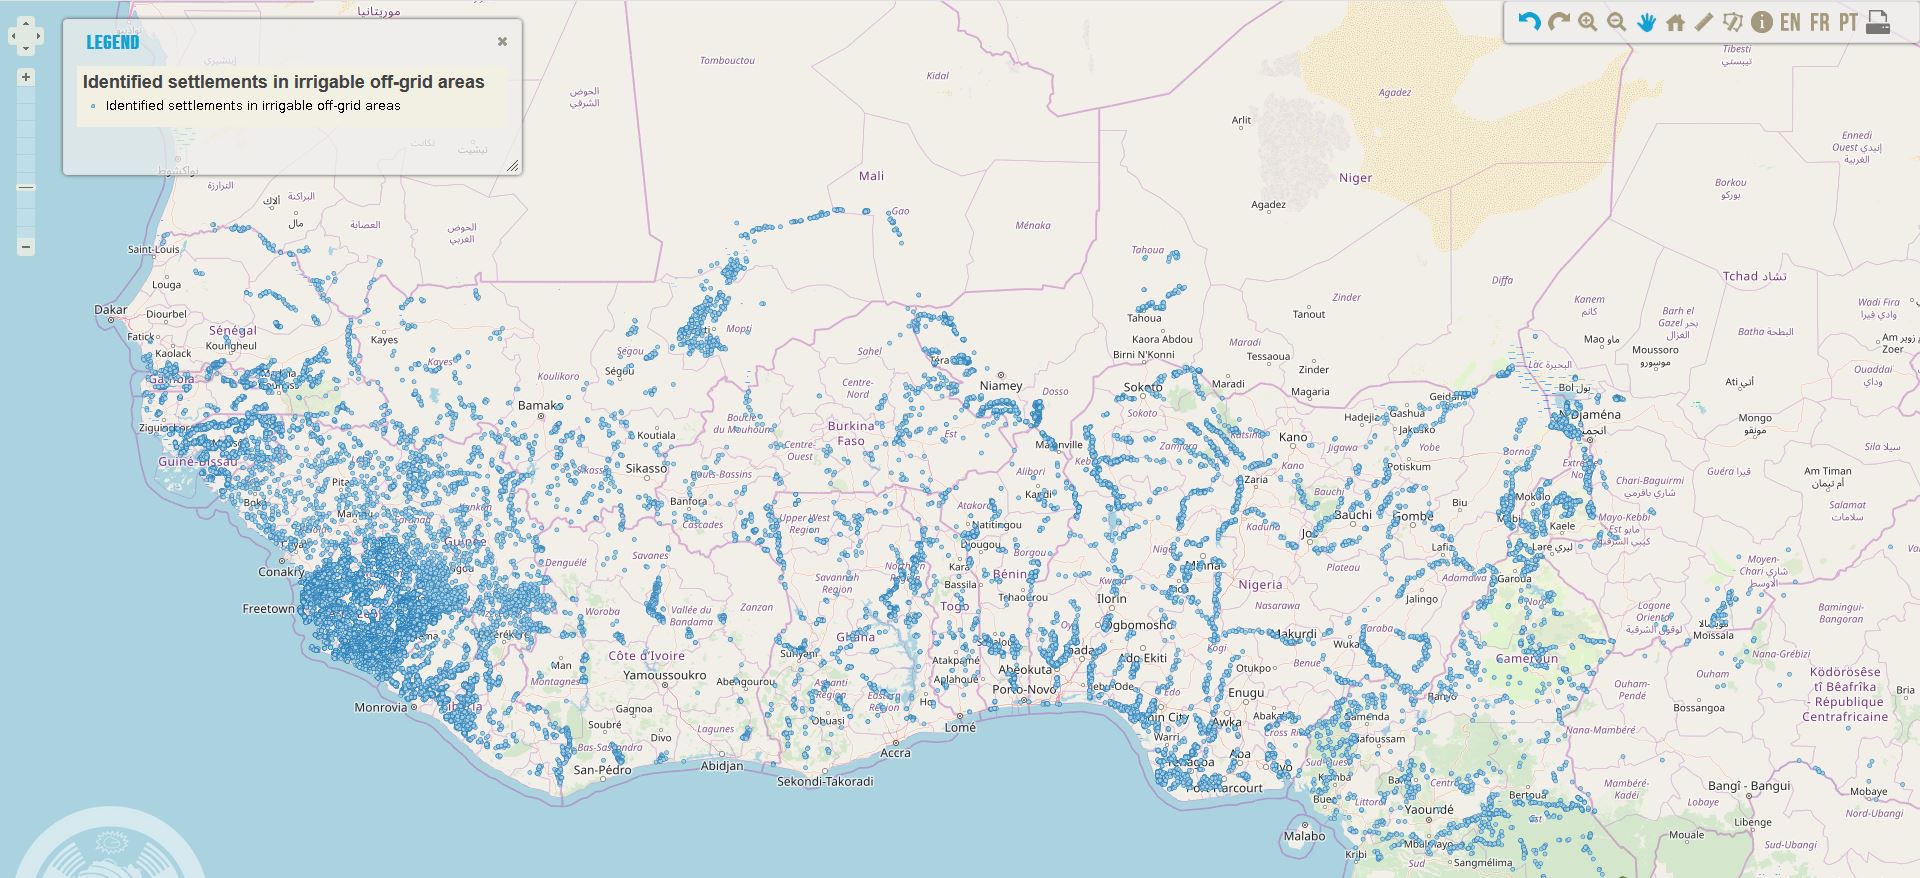
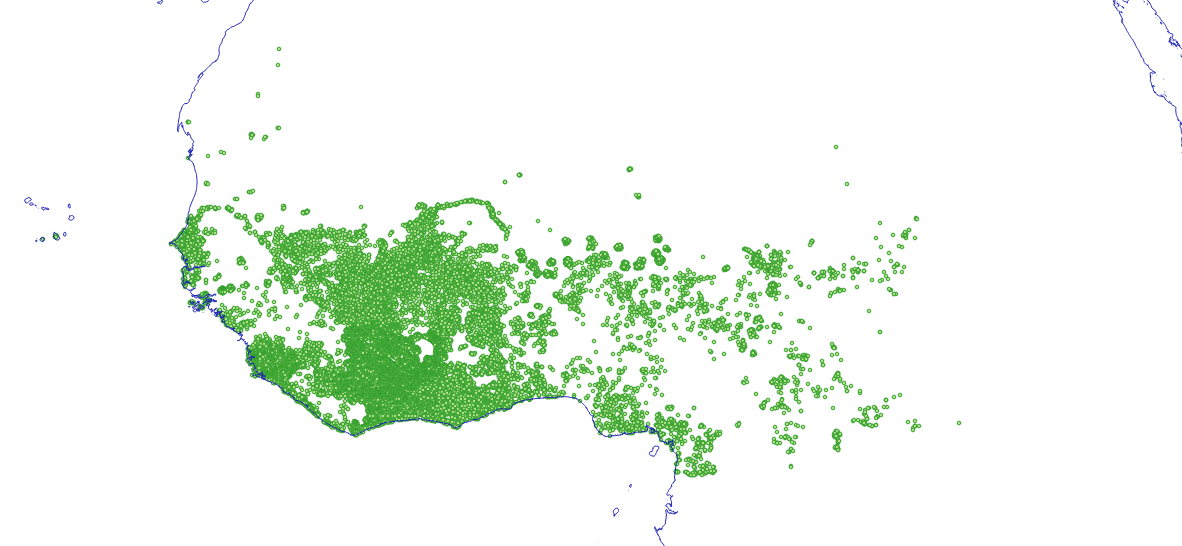
Location of settlements in West Africa in identified irrigable off-grid areas in 2018, that could still be in off-grid areas in 2023 according to the least-cost analysis conducted in the framework of the off-grid solar market assessment and private sector support facility design, which was done as an activity of the sub-component 1A of the Regional Off-Grid Electrification Project (ROGEP).
-
Location of settlements that could have access to electricity through mini-grids in 2023 according to the least-cost analysis conducted in the framework of the off-grid solar market assessment and private sector support facility design, which was done as an activity of the sub-component 1A of the Regional Off-Grid Electrification Project (ROGEP).
-
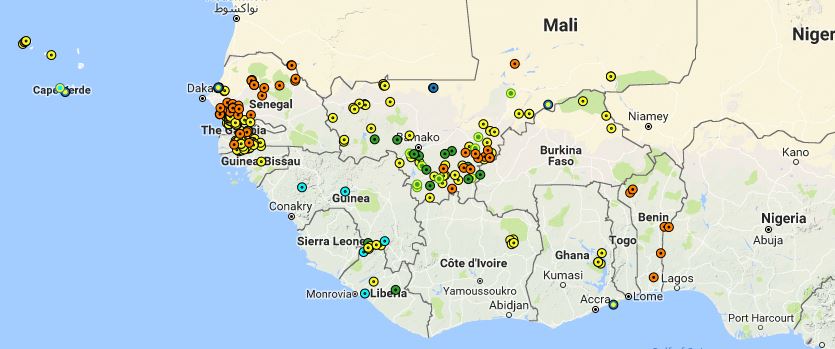
Operational Clean Energy Mini-grids in the ECOWAS region. The projects provided are based on the best available data, either reported by national experts from Rural Electrification Agencies in the countries, other relevant institutions or CEMG operators. The dataset contains the projects for which the location is known (geographic coordinates). To check the complete list of operational CEMGs please visit the country profiles section on ECOWREX
-

Drainage Network and Inland Water Bodies of Senegal
-
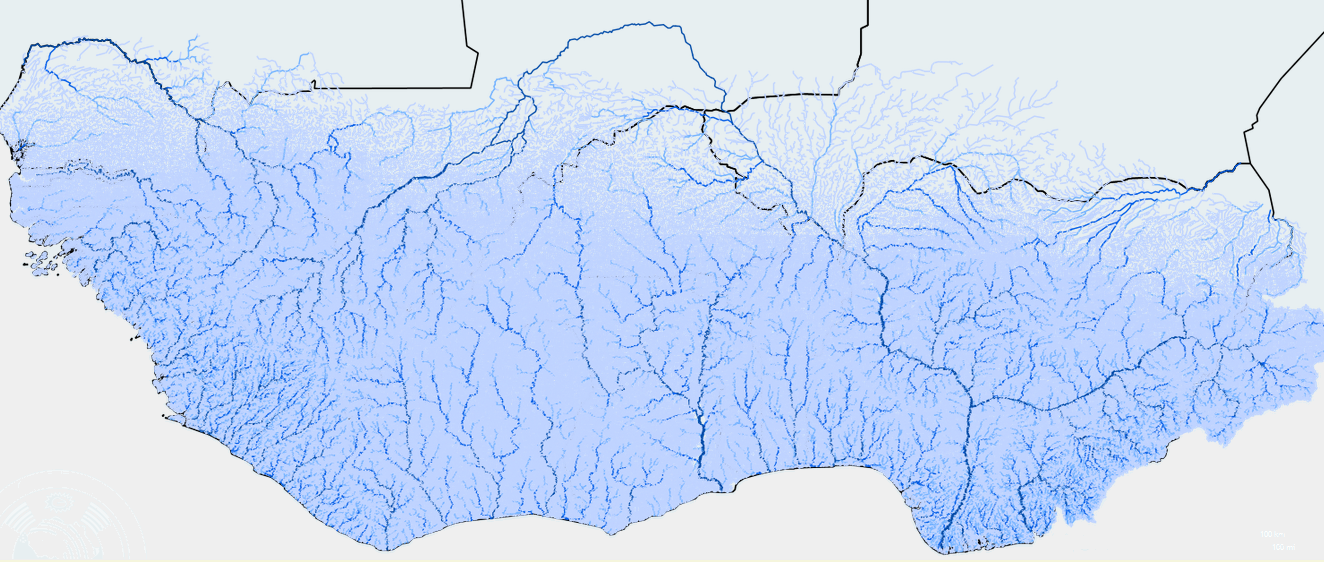
This dataset shows the river network for West Africa and the estimated hydropower potential as well as several other interesting attributes. After detailed calculation, the attribute values were rounded to a reasonable accuracy. This dataset is not intended for local studies but only for regional comparison. The dataset was created using the following methodology: 1. The river network was derived from the Hydrosheds 15s dataset: a) A threshold of 10 cells in the flow accumulation grid was used to delineate river reaches. b) Reaches with zero long-term mean annual discharge (rounded at 0.000 m³/s) were removed. c) Some remaining reaches in desert areas were manually removed. d) Small tributary reaches in reservoir water bodies were manually removed. e) The topology between adjacent reaches was computed from nodes and the flow accumulation grid (to determine which of the adjacent reaches is located downstream). 2. Discharge was computed with an annual water balance model using precipitation (TRMM) and potential evapotranspiration (CRU) as inputs. The water balance model was calibrated with observed discharge data of about 400 gauges (Global Runoff Database). The last cellpoint at the river network before a confluence with a downstream reach at 15s Hydrosheds resolution was used to query discharge from the discharge grid. The monthly distribution of discharge was computed by superimposing a specific seasonality derived from observed discharge data. At some rivers (Niger, Bani, Yobe) diversions and evaporation losses were roughly considered. 3. Computation of slope for each river reach: a) Compute length of reaches. b) Aggregate Hydrosheds unconditioned DEM (based on SRTM DEM) from 3s resolution to 15s resolution. After extensive testing (also with ASTER DEM) the 10% percentile of the 3s elevation values within the 15s box was selected as aggregation value. c) Extract upstream and downstream elevation for each reach from the aggregated DEM (see previous step). d) Adjust upstream and downstream reach elevation values with the following method: i. Adjustment of elevation in downstream direction by carving through barriers. ii. Adjustment of elevation in upstream direction by filling sinks. iii. Compute average of previous two steps. e) Smoothing of elevation along the river network. Differentiate between main rivers and tributaries in the smoothing process. Several rounds of smoothing with different settings were applied. f) Consider artificial reservoirs (e.g. Lake Volta) by ensuring zero slope in reservoir water bodies. 4. Slope was computed from length and elevation difference. 5. Gross theoretical hydropower potential (attribute POWER) was computed from mean annual discharge (Q_YEAR) and elevation difference in reach (ELEV_DIFF). Specific hydropower potential (POWER_SPEC) was computed from POWER and reach length. 6. Preferred hydropower plant size is based on a classification scheme using specific hydropower potential (attribute POWER_SPEC) and mean annual discharge (attribute Q_YEAR). The classification scheme is based on an analysis of existing hydropower plants in West Africa and some general considerations for hydropower plant design. 7. River names were manually assigned by comparison with the following data sources: a) GRDC gauges b) Nigeria JICA gauges c) Sierem GIS dataset d) Google maps e) Open Streetmap f) Michelin map (online version) g) Travelmag map (analog version) h) Various other sources (Wikipedia, detailed local maps, etc.) 8. For rivers forming international borders the country entries in the attribute table were manually assigned. The manual editing was required because the GIS datasets (river network and countries) do not align fully accurate at country borders. 9. Future change in annual discharge was computed by running the water balance model using the delta-change method for future precipitation and air temperature. The climate change projections were extracted from 30 Regional Climate Model (RCM) runs included in the CORDEX-Africa ensemble for the representative concentration pathways RCP4.5 and RCP8.5. Future change in potential evapotranspiration was estimated using an empirical relationship between air temperature and potential evapotranspiration. The following tools were used for creating this dataset: • ArcGIS 9.2: main GIS tool • ArcGIS 10.0: Python scripting and model building • ArcView 3.1: specific tasks with large attribute tables where more recent GIS versions fail • GDAL: automatic merging of DEM tiles • Fortran: main processing tool for various tasks o Pre-processing of GPCC and satellite precipitation data o Water balance modelling o Spatial aggregation of DEMs from 3s to 15s resolution o Adjustment of reach elevation (fill sinks, carve through barriers, smoothing) • MS Excel: some data pre-processing and visualization • Libre Office: dbf file manipulation • CDO: Climate Data Operators for processing of CORDEX-Africa climate model data • Shell scripts: For automatic file processing of climate model data • Batch scripts: For automatic calls to Fortran programs For each reach of the river network the following attributes are available (units in brackets): • ARCID: ID number of reach • TOARCID: ID number of next downstream reach • FROMARCID: ID number of dominant upstream reach (largest inflow) • NB: ID number of sub-area • RIVER: River name (English) • RIVER_FREN: River name (French) • COUNTRY_1: Country (ISO code) • COUNTRY_2: Second country (ISO code) if reach forms international border • AREA_Km2: Total upstream catchment area (km²) of reach • LENGTH_Km: Length (km) of reach • EXRIVER: Flag indicating external river originating from another sub-area (0: local river, 1: external river) • ELEV_US_m: Elevation (m) at upstream end of reach • ELEV_DS_m: Elevation (m) at downstream end of reach • ELEV_DIFF: Elevation difference (m) in reach • SLOPE: Slope (m/m) of reach • PWR_MW: Theoretical hydropower potential (MW) for the period 1998-2014 • PWR_MW_KM: Specific hydropower potential (MW/km) for the period 1998-2014 • QYEAR_m3_s: Mean annual discharge (m³/s) simulated for the period 1998-2014 • QJAN_m3_s: Mean monthly discharge (m³/s) 1998-2014 in January • QFEB_m3_s: Mean monthly discharge (m³/s) 1998-2014 in February • QMAR_m3_s: Mean monthly discharge (m³/s) 1998-2014 in March • QAPR_m3_s: Mean monthly discharge (m³/s) 1998-2014 in April • QMAY_m3_s: Mean monthly discharge (m³/s) 1998-2014 in May • QJUN_m3_s: Mean monthly discharge (m³/s) 1998-2014 in June • QJUL_m3_s: Mean monthly discharge (m³/s) 1998-2014 in July • QAUG_m3_s: Mean monthly discharge (m³/s) 1998-2014 in August • QSEP_m3_s: Mean monthly discharge (m³/s) 1998-2014 in September • QOCT_m3_s: Mean monthly discharge (m³/s) 1998-2014 in October • QNOV_m3_s: Mean monthly discharge (m³/s) 1998-2014 in November • QDEC_m3_s: Mean monthly discharge (m³/s) 1998-2014 in December • Q_2035_P25: Change in future mean annual discharge in % (2026-2045 vs. 1998-2014) for the lower quartile simulation using 30 climate model runs of the CORDEX-Africa ensemble (RCP4.5 and RCP8.5) • Q_2035_P50: Change in future mean annual discharge in % (2026-2045 vs. 1998-2014) for the median simulation using 30 climate model runs of the CORDEX-Africa ensemble (RCP4.5 and RCP8.5) • Q_2035_P75: Change in future mean annual discharge in % (2026-2045 vs. 1998-2014) for the upper quartile simulation using 30 climate model runs of the CORDEX-Africa ensemble (RCP4.5 and RCP8.5) • Q_2055_P25: Change in future mean annual discharge in % (2046-2065 vs. 1998-2014) for the lower quartile simulation using 30 climate model runs of the CORDEX-Africa ensemble (RCP4.5 and RCP8.5) • Q_2055_P55: Change in future mean annual discharge in % (2046-2065 vs. 1998-2014) for the median simulation using 30 climate model runs of the CORDEX-Africa ensemble (RCP4.5 and RCP8.5) • Q_2055_P75: Change in future mean annual discharge in % (2046-2065 vs. 1998-2014) for the upper quartile simulation using 30 climate model runs of the CORDEX-Africa ensemble (RCP4.5 and RCP8.5) • PLANT_SIZE: Preferred hydropower plant size (0: none, 1: <1MW, 2: 1-30MW, 3: >30MW installed capacity) • LAT: Latitude (decimal degrees North) at end of reach • LON: Longitude (decimal degrees East) at end of reach