 PAUWES Data Portal
OGC:OWS-C
Keywords
Contact for the resource
Provided by
Years
Formats
Representation types
Update frequencies
status
Scale
-
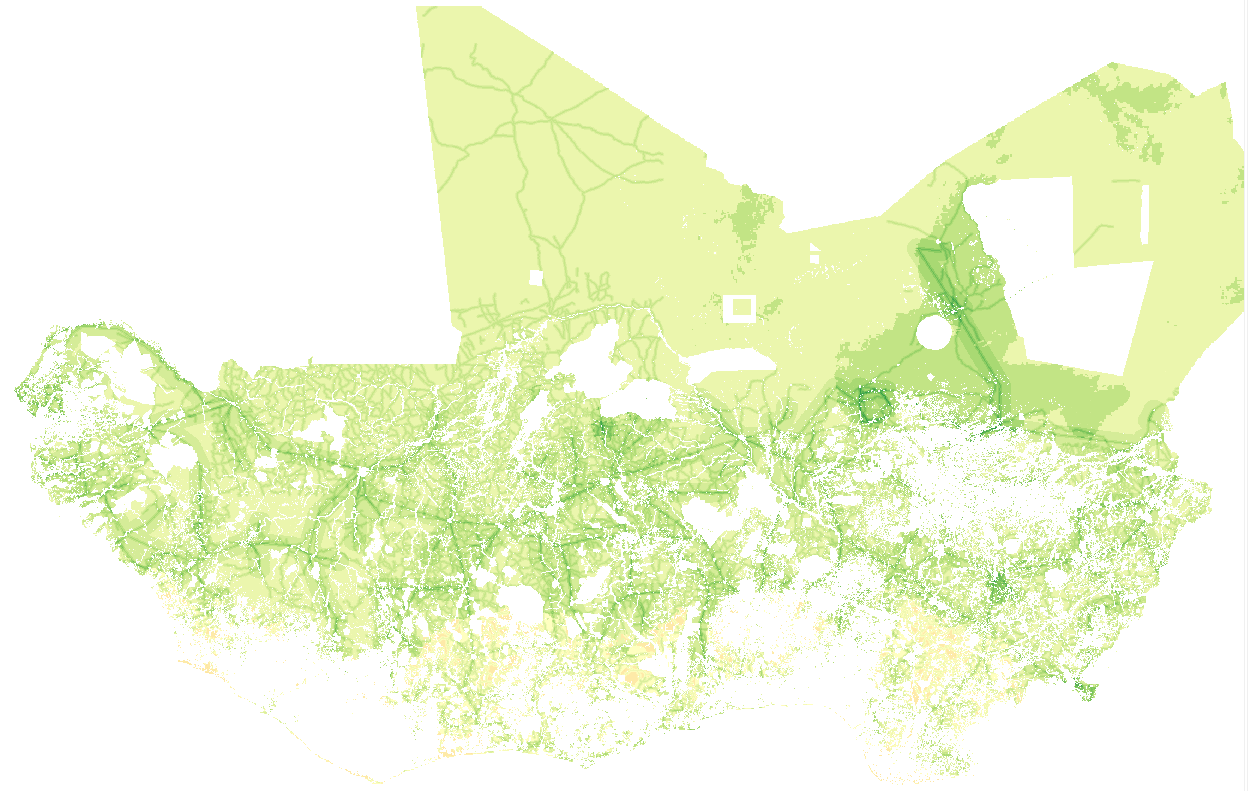
The suitability maps, contain information on locations suitable for installation of the respective wind electricity generation systems in accordance with the restrictive criteria adopted. Locations are evaluated according to their suitability for onshore wind systems deployment according to topographical, legal, and social constraints, and well as factors that could facilitate or impede wind generation development. The present study focus exclusively on land suitability for the installation of onshore wind turbine and wind farm. The study is conducted on a regional scale. The results can be used for identification of potential areas of interest for solar generation deployment, and as a support for integration between electricity grid expansion and off-grid electrification policies. Grid connected installations - ecological scenario: Installation connected to the electrical grid, environmental impacts minimized
-
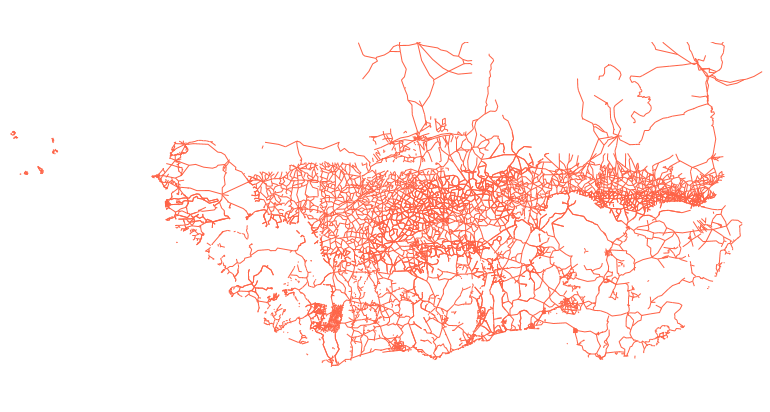
Data provides an estimated framework of the current railway network in the ECOWAS region
-
The suitability maps, contain information on locations suitable for installation of the respective solar systems in accordance with the restrictive criteria adopted. Locations are evaluated according to their suitability for solar systems deployment according to topographical, legal, and social constraints, as well as factors that could facilitate or impede solar generation development. The study is conducted on a regional scale. The results can be used for identification of potential areas of interest for solar generation deployment, and as a support for integration between electricity grid expansion and off-grid electrification policies.
-

The resource was developed by NEXANT (EEUU) for ECREEE using 3TiER global dataset. The methodology is explained in the resource below available for downloading. Dataset is available in raster format (.geotiff) with a resolution of 3,5 km.
-

The data provides information about the development of the Gas Pipeline project for West Africa, including the gas station at each Member state. Data was compiled by ECREEE from the West African Gas Pipeline Company’s (WAPCO).
-
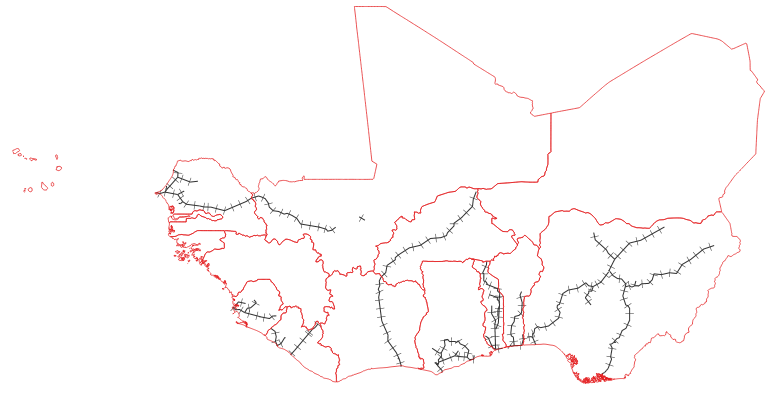
Estimated data of the entire primary and secondary road network in West Africa including the road surface type, condition and traffic volume in shapefile format. Data was compiled by TECSULT for the Infrastructure Consortium for Africa (ICA), a project which was led by the World Bank.
-
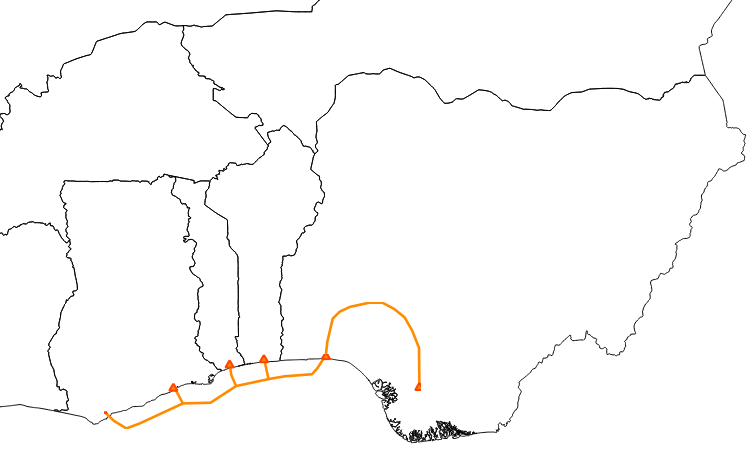
Data provides information about the development of the Gas Pipeline project for West Africa, including the gas station at each Member state. Compiled by ECREEE from the West African Gas Pipeline Company’s (WAPCO).
-
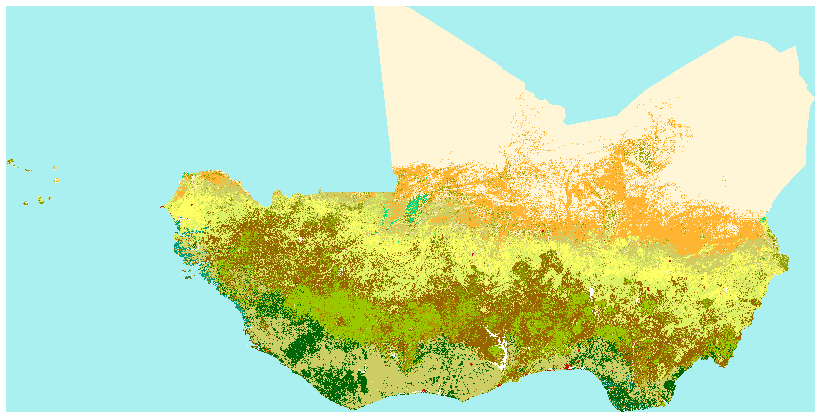
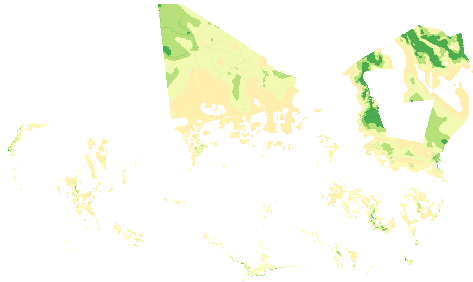
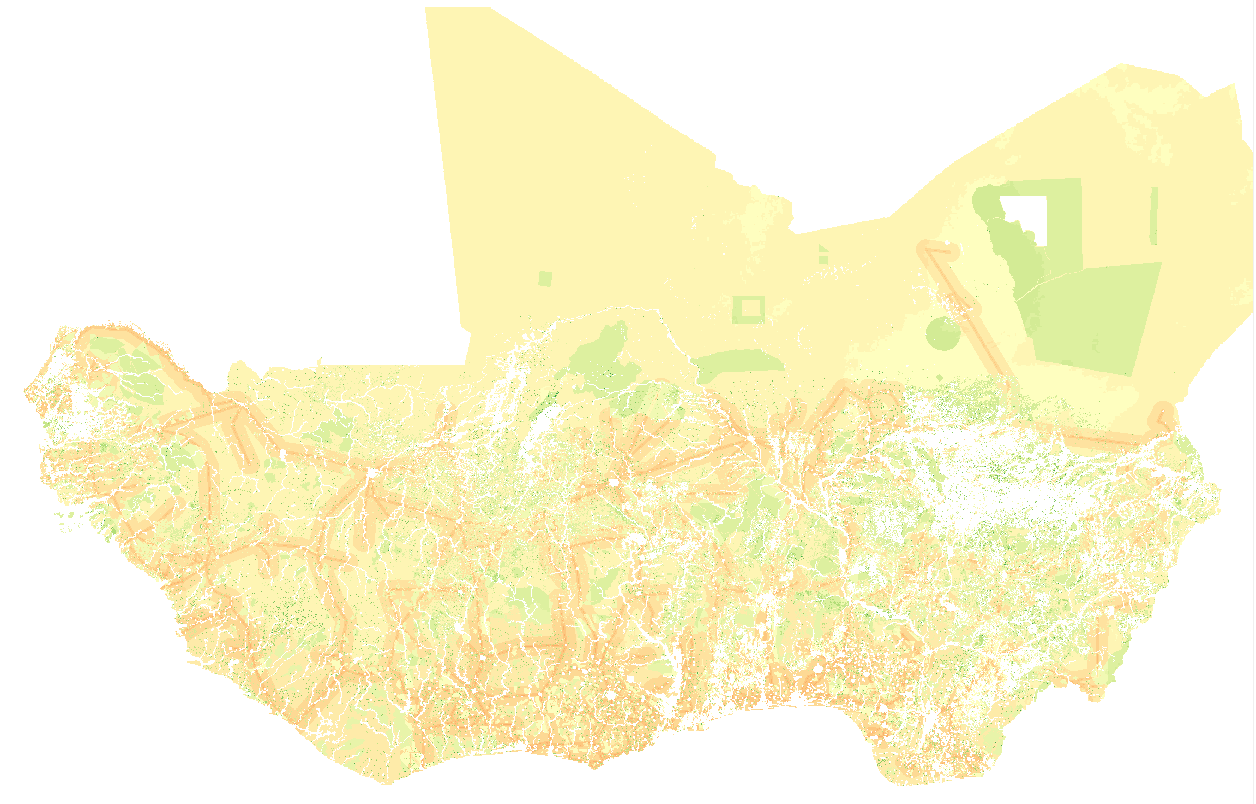
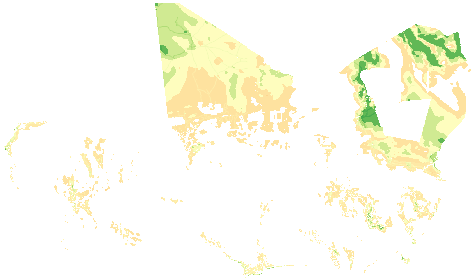
The Africa land cover map is a regional component of the GLC2000 exercise, conceived and coordinated by the European Commission’s Joint Research Centre. From the Africa land cover map, which is a regional component of the GLC2000 exercise, conceived and coordinated by the European Commission’s Joint Research Centre. The GLC2000 maps are based on daily observations made from 1st November 1999 to 31st December 2000 by the VEGETATION sensor on the SPOT 4 satellite. Legend- definition of the Gray index value: -11: post-flooding or irrigated croplands -14: rainfed croplands -20: mosaic cropland (50-70%) / Vegetation (grassland, shrubland, forest) (20-50%) -30: mosaic vegetation (grassland, shrubland, forest) (50-70%) / cropland (20-50%) -40: closed to open (>15%) broadleaved evergreen and/or semi-deciduous forest (>5m) -50: closed (>40%) broadleaved deciduous forest (>5m) -60: open (15-40%) broadleaved deciduous forest (>5m) -70: closed (>40%) needleleaved evergreen forest (5m) -90: open (15-40%) needleleaved deciduous or evergreen forest (5m) -100: closed to open (>15%) mixed broadleaved and needleleaved forest (>5m) -110: mosaic forest / shrubland (50-70%) / grassland (20-50%) -120: mosaic grassland (50-70%) / forest/shrubland (20-50%) -130: closed to open (>15%) shrubland (<5m) -140: closed to open (>15%) grassland -150: sparse (>15%) vegetation (woody vegetation, shrubs, grassland) -160: closed (>40) broadleaved forest regularly flooded- fresh water -170: closed (>40%) broadleaved semi-deciduous and/or evergreen forest regularly flooded- saline water -180: closed to open (>15%) vegetation (grassland, shrubland, woody vegetation) on regularly flooded or waterlogged soil- fresh, brackish or saline water -190: artificial surfaces and associated areas (urban areas >50%) -200: bare areas -210: water bodies -220: permanent snow and ice
-
The suitability maps, contain information on locations suitable for installation of the respective solar systems in accordance with the restrictive criteria adopted. Locations are evaluated according to their suitability for solar systems deployment according to topographical, legal, and social constraints, as well as factors that could facilitate or impede solar generation development. The study is conducted on a regional scale. The results can be used for identification of potential areas of interest for solar generation deployment, and as a support for integration between electricity grid expansion and off-grid electrification policies.
-
The suitability maps, contain information on locations suitable for installation of the respective wind electricity generation systems in accordance with the restrictive criteria adopted. Locations are evaluated according to their suitability for onshore wind systems deployment according to topographical, legal, and social constraints, and well as factors that could facilitate or impede wind generation development. The present study focus exclusively on land suitability for the installation of onshore wind turbine and wind farm. The study is conducted on a regional scale. The results can be used for identification of potential areas of interest for solar generation deployment, and as a support for integration between electricity grid expansion and off-grid electrification policies. Grid connected installations - practical scenario: Installation connected to the electrical grid, ease of installation maximized